The energy level of a specific electron bound to the nucleus in an atom is affected by all the other bound electrons, and to some extent also by any unbound electrons that surround it. The energy of the x-rays from a partially ionized atom therefore depends on the ionization level. More highly ionized atoms turn out to emit higher-energy Kalpha and Kbeta lines, made by transitions to the K-shell from the L-shell and the M-shell, than a cold, un-ionized atom.
The Gamble II pulsed power machine produces about a terawatt electrical power, from a pulse with nominally 1 MeV peak electron energy, 1 MA peak current, and 100 ns pulse width. The so-called plasma-filled rod pinch, pfrp, is a geometry that concentrates a substantial part of this this power in a small amount of material, thereby creating a small amount of highly ionized and relatively dense plasma that makes for an intense x-ray source. The standard material in the pfrp is tungsten. One interesting question is: is the tungsten in the prfp ionized enough to see a change in tungsten's K-line energy?
A series of shots on Gamble II, from 08sep2009 to 25sep2009, tried to answer this and related questions, by acquiring x-ray spectra from a high-resolution spectrograph that is being evaluated for this and similar applications in the process. Since the instrument is interesting to more than a few people that are not at the same site, and the .tif images that can be analyzed with codues such as ImageJ are too large (5 Mb) to send around by email, they can be downloaded here. This website is slow (0.2 Mb/min, in one test), so the same images are supplied in .jpg format, for information only but not for further analysis.
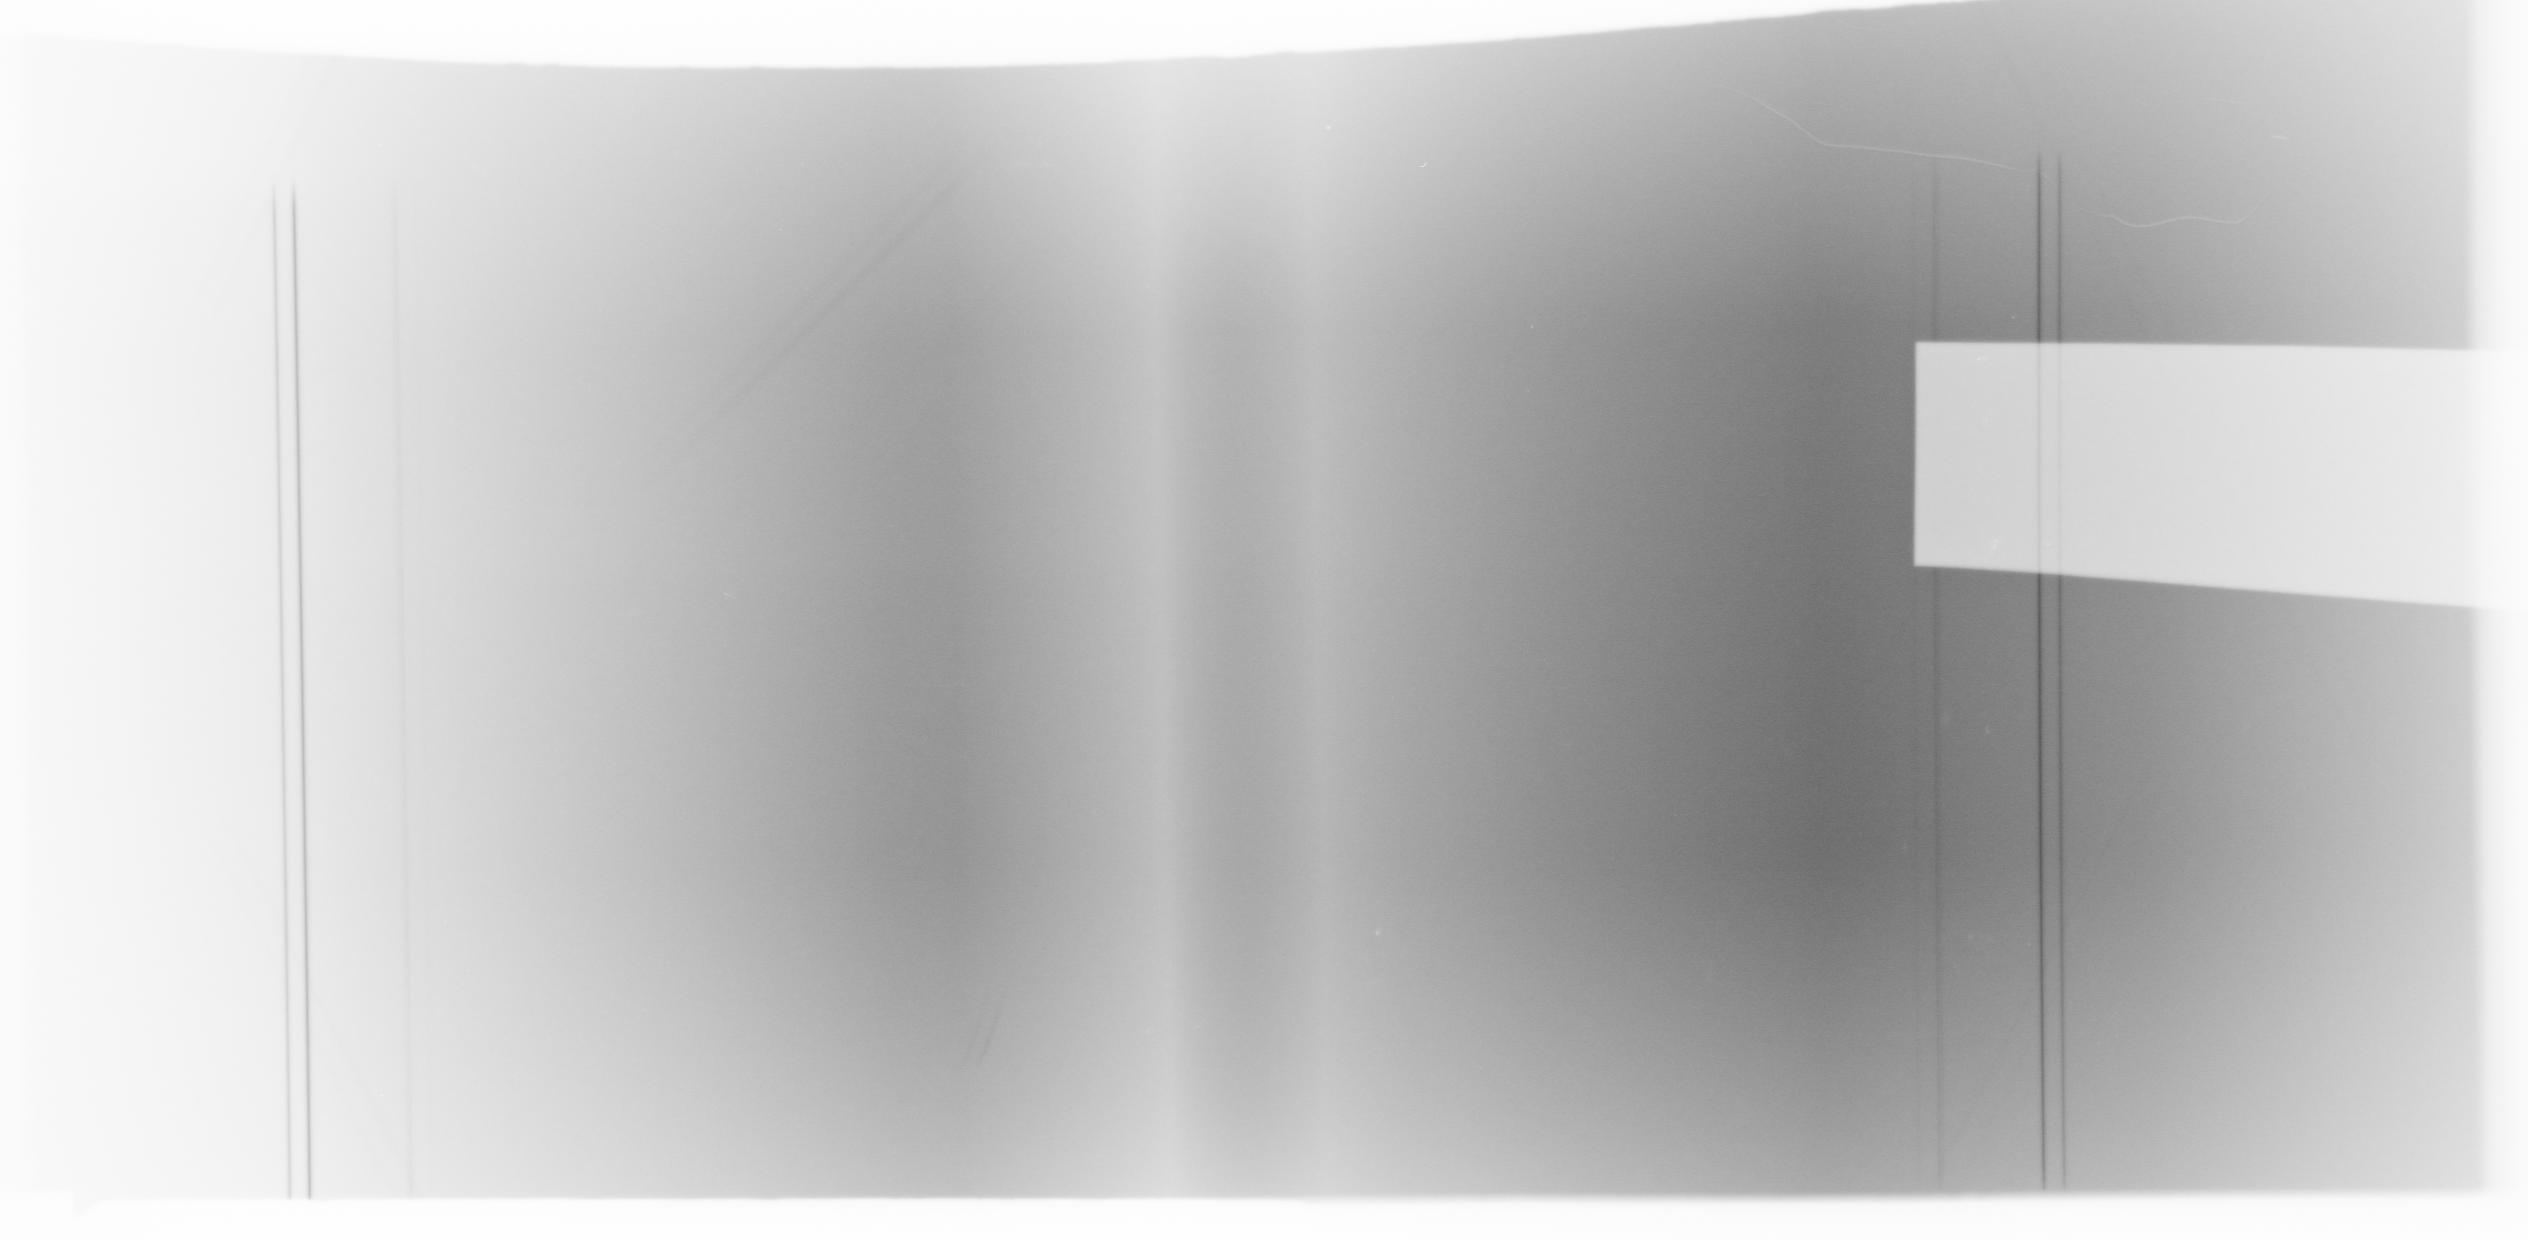
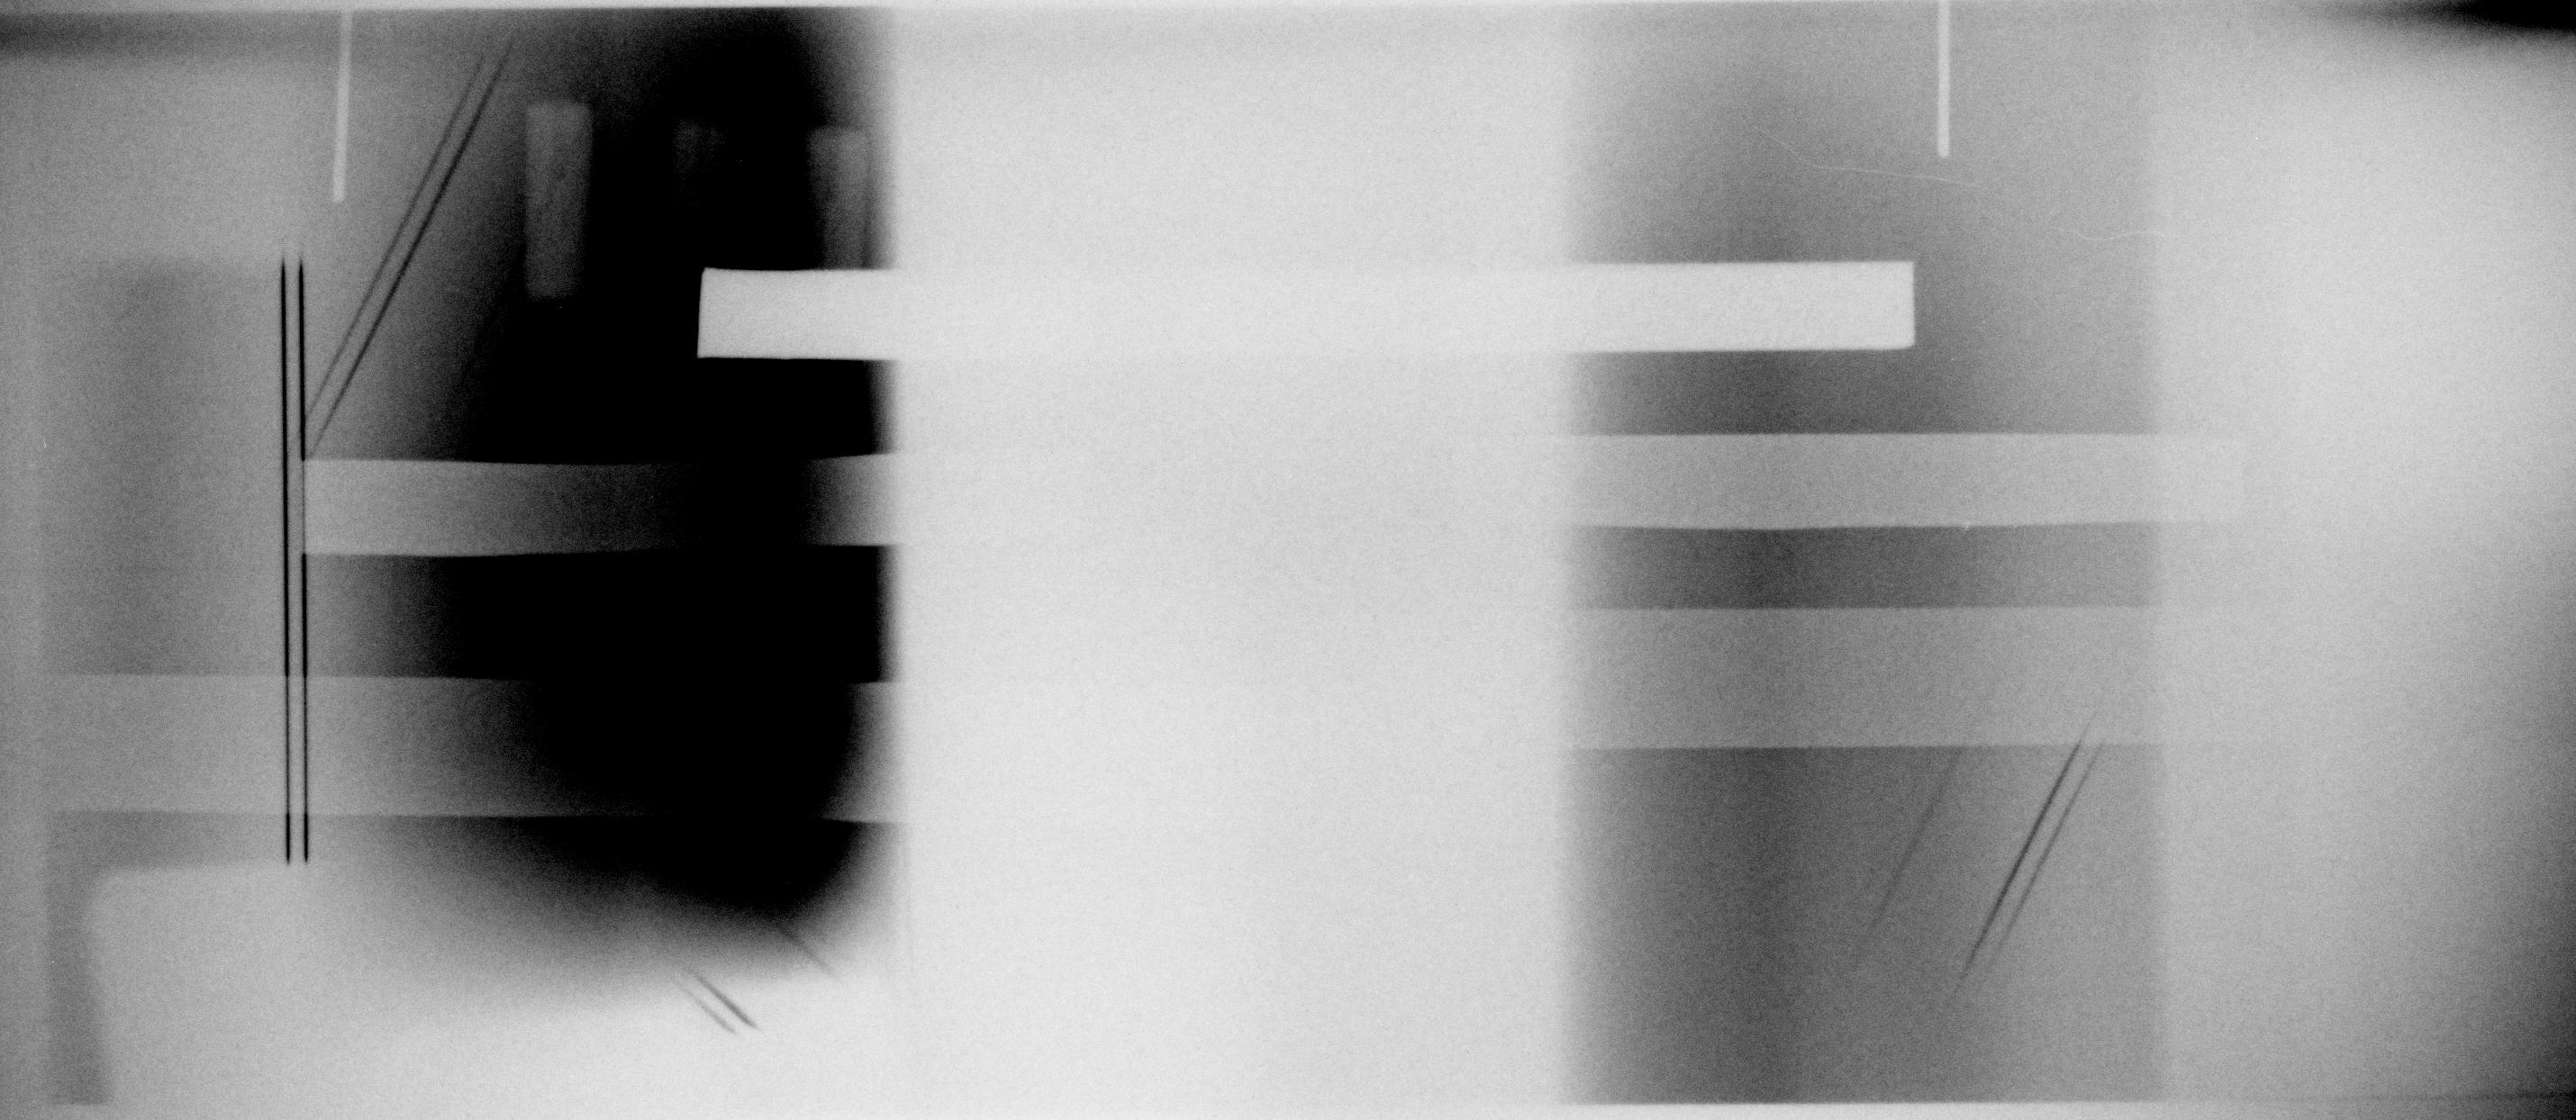
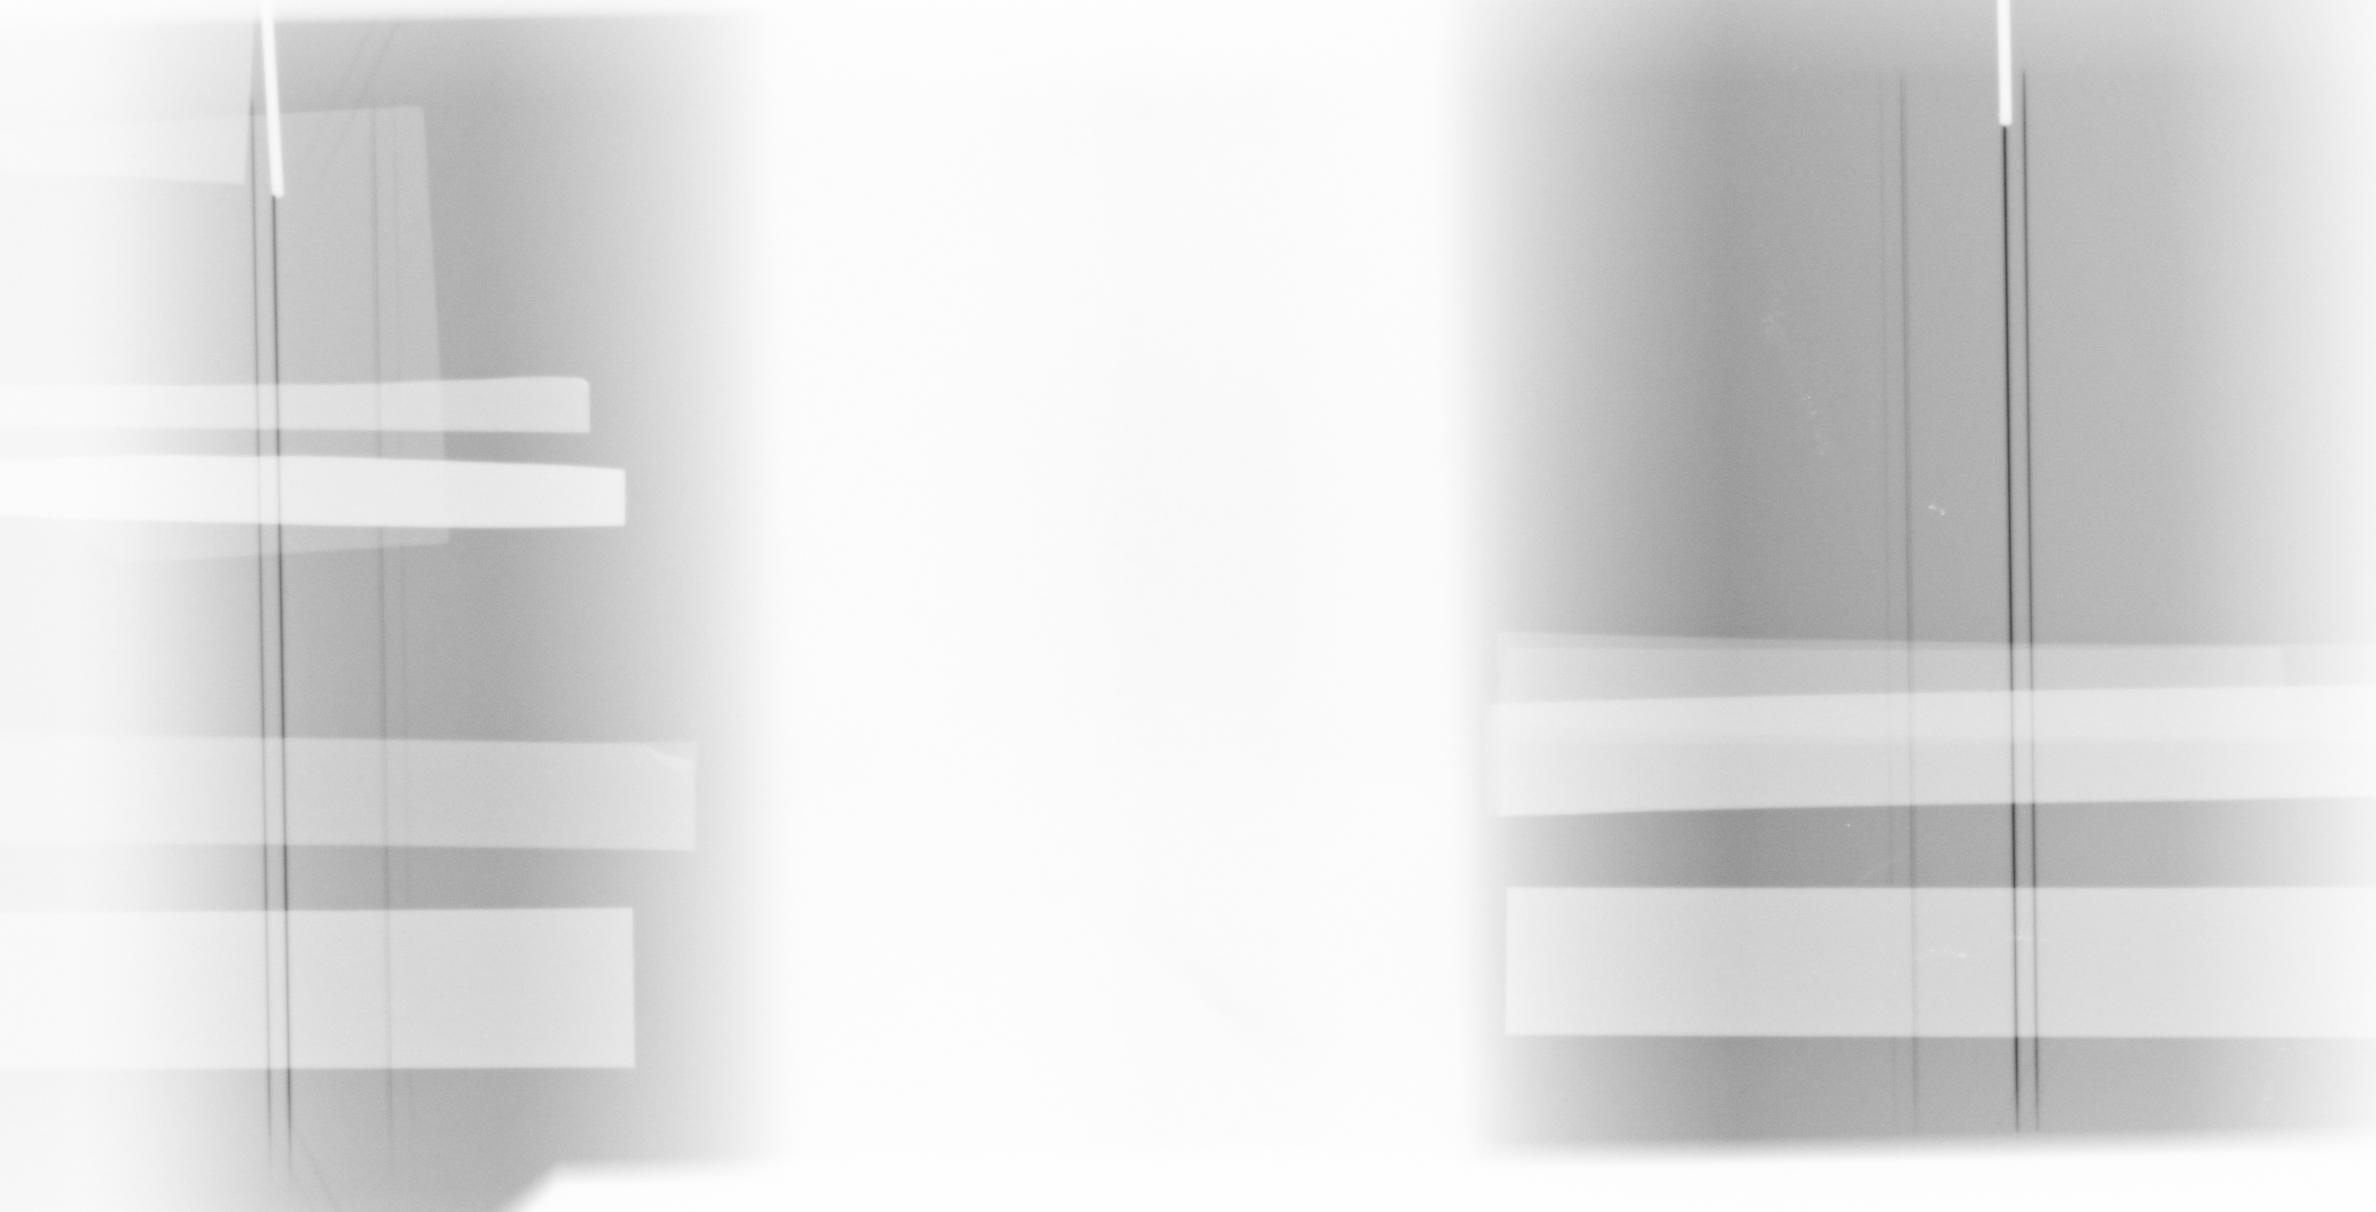
Shot 9524 is filled with W or Pb wherever shield blocks could be put inside the spectrometer. Moreover, the shielding between the two apertures is beefed up with trapezoidal pieces on both sides of the crystal, we refer to as "schnozzes", and the front face is shielded as much as the available space allows. On one side the shielding is effective, on the other side less so, but lines are very visible now on both sides. A tighter geometry should take care of some weak slanted lines. The lighter band comes from x-ray absorption in 0.254 mm thick hafnium (The jpg is here).
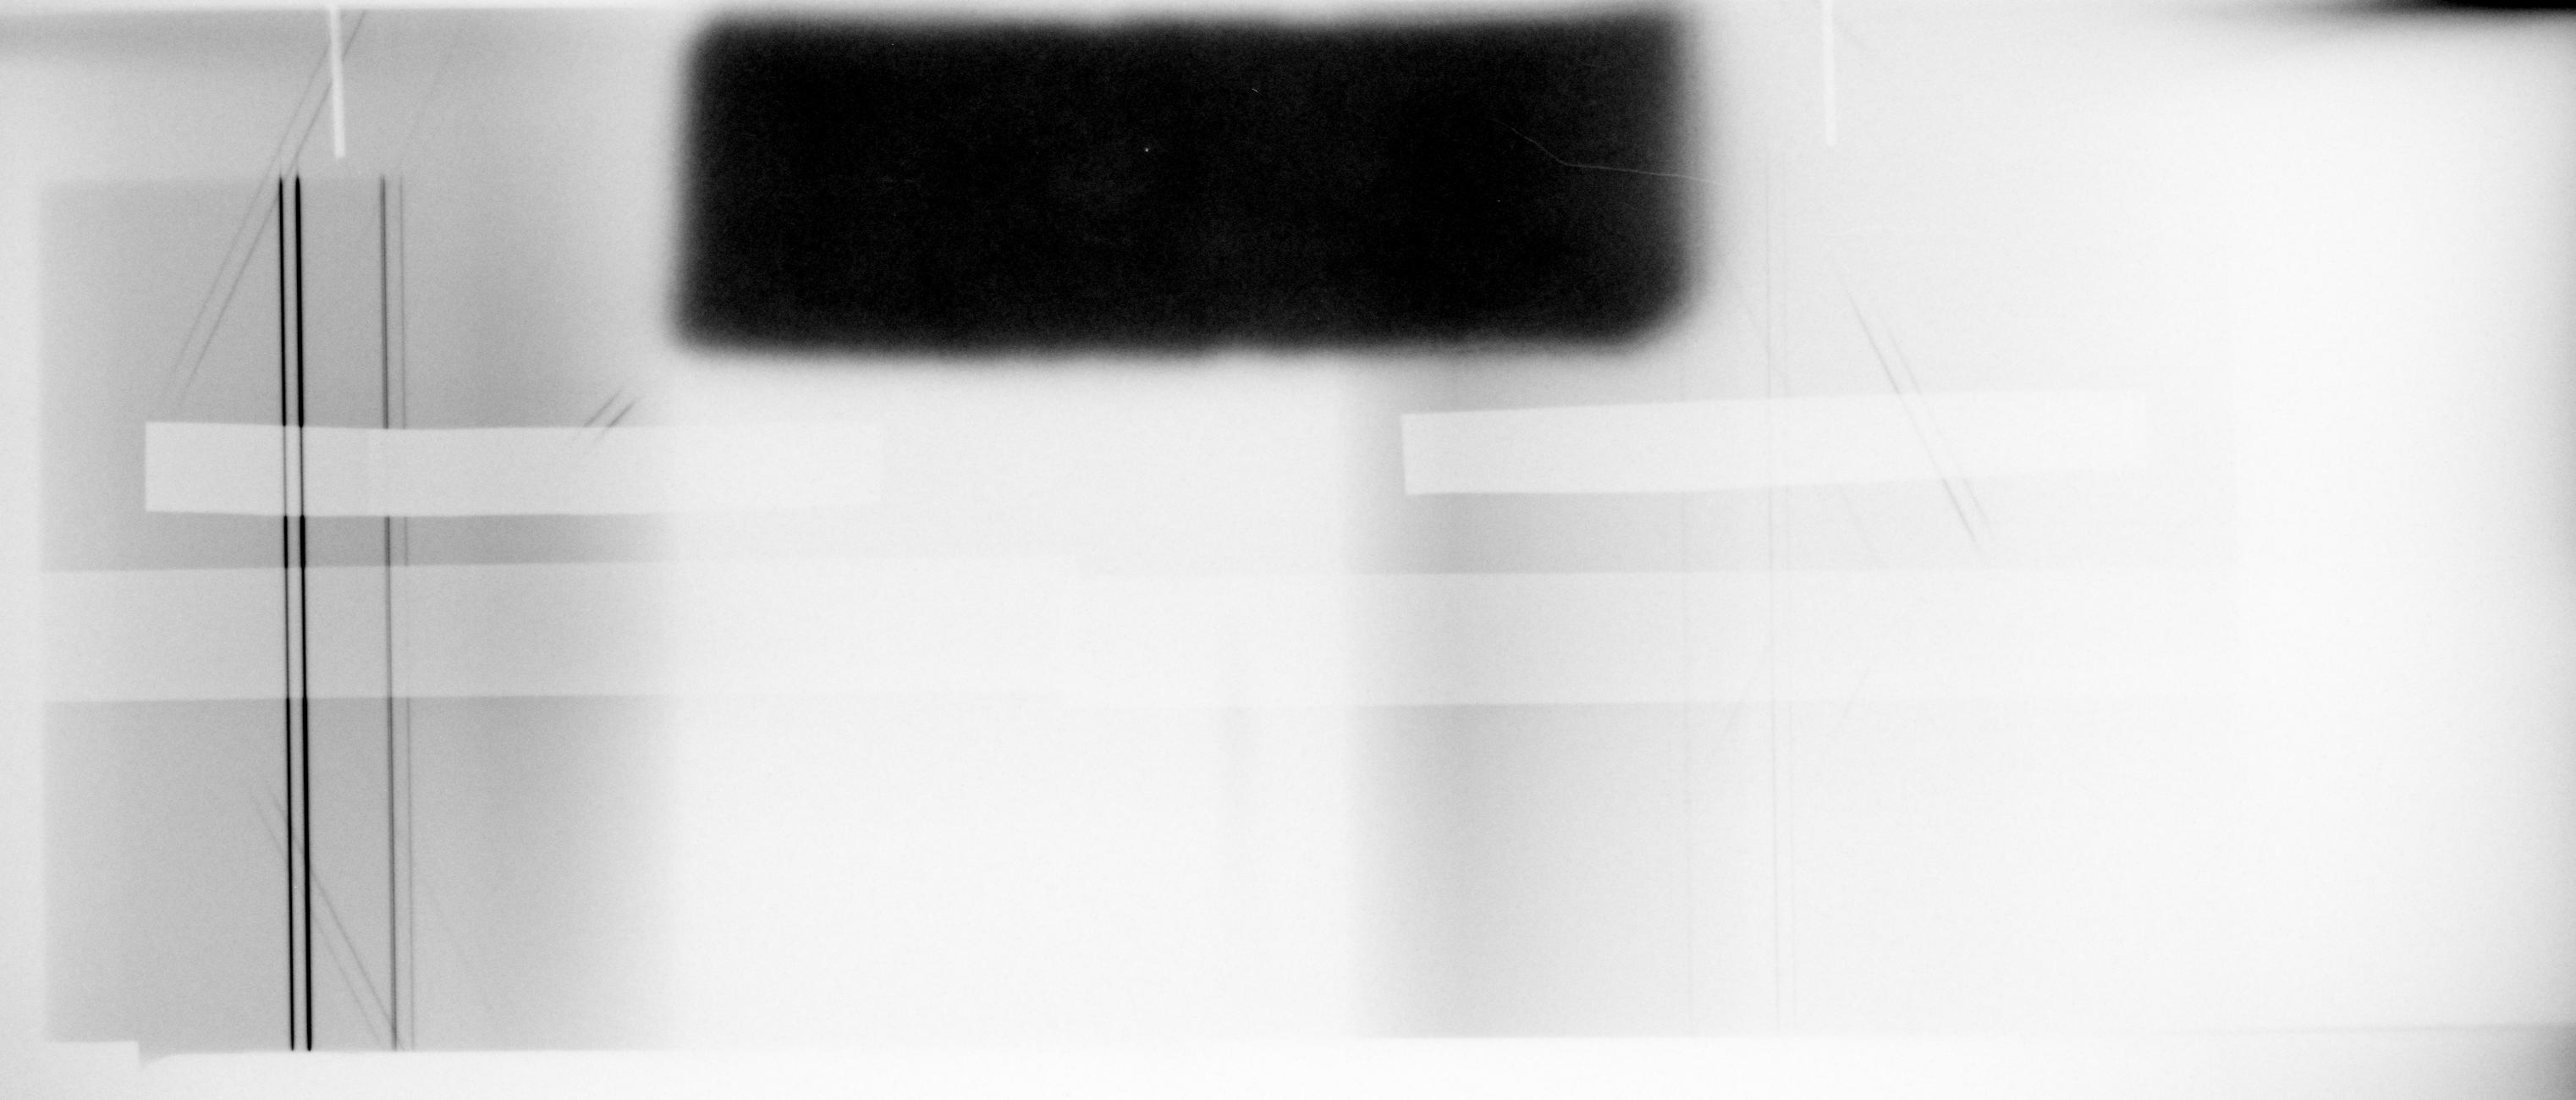
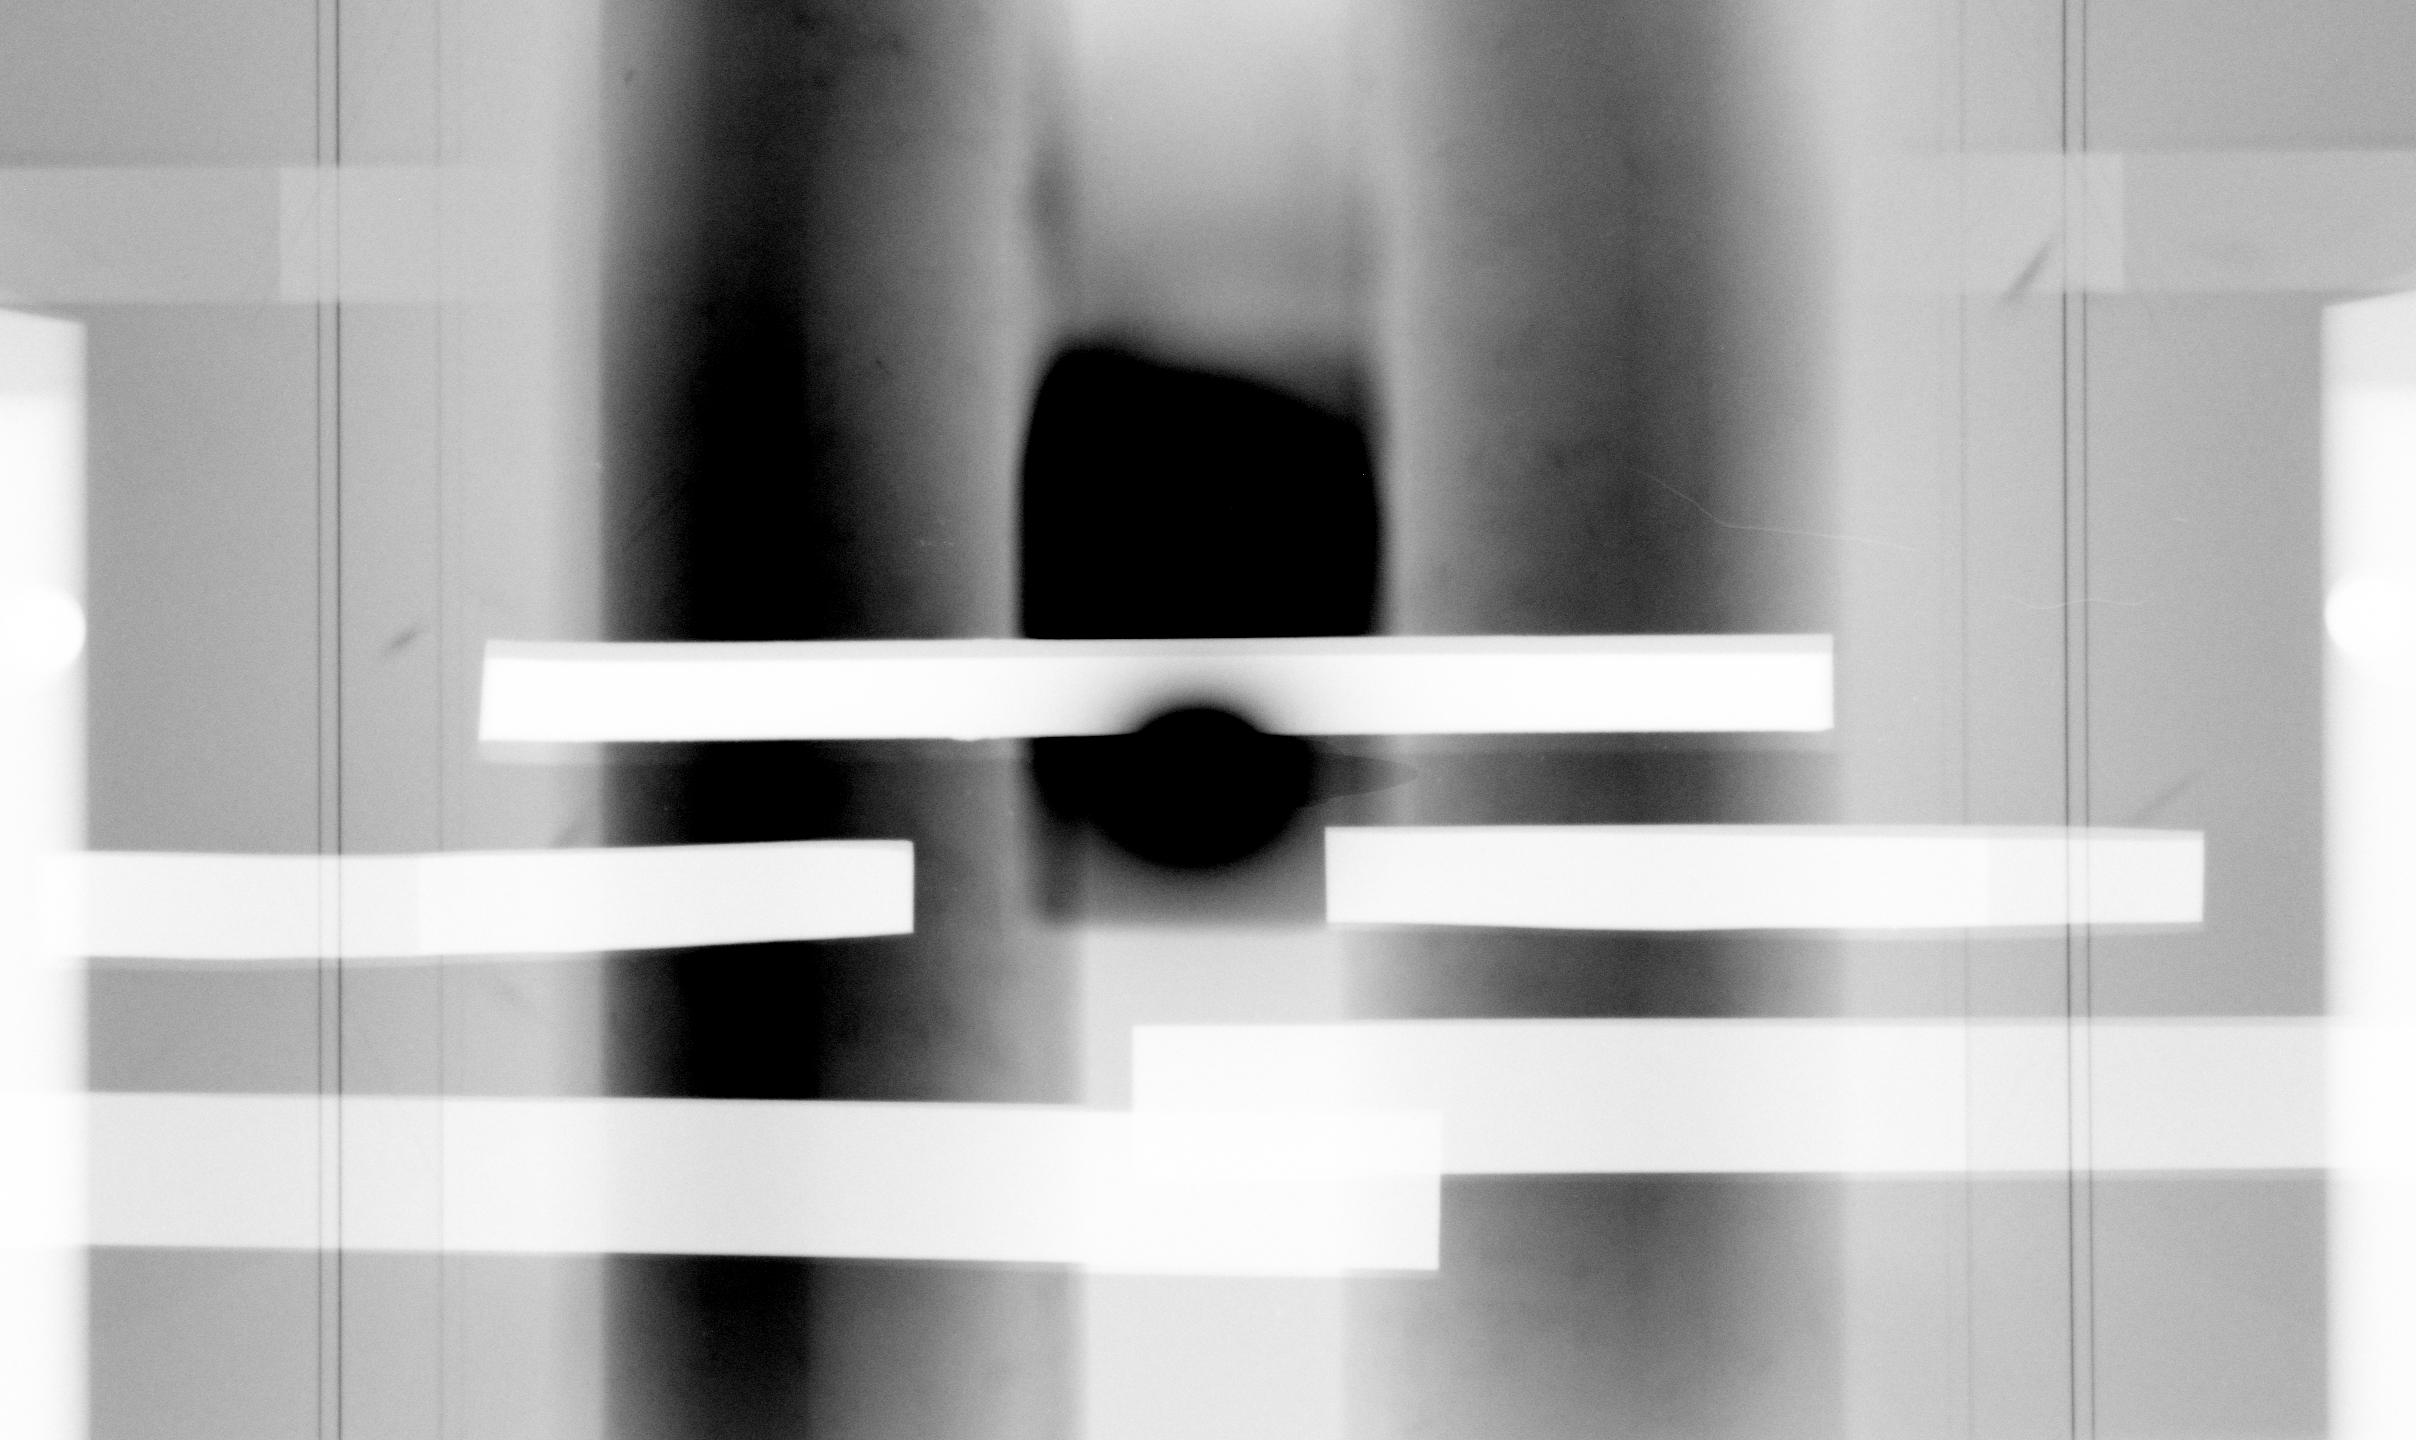
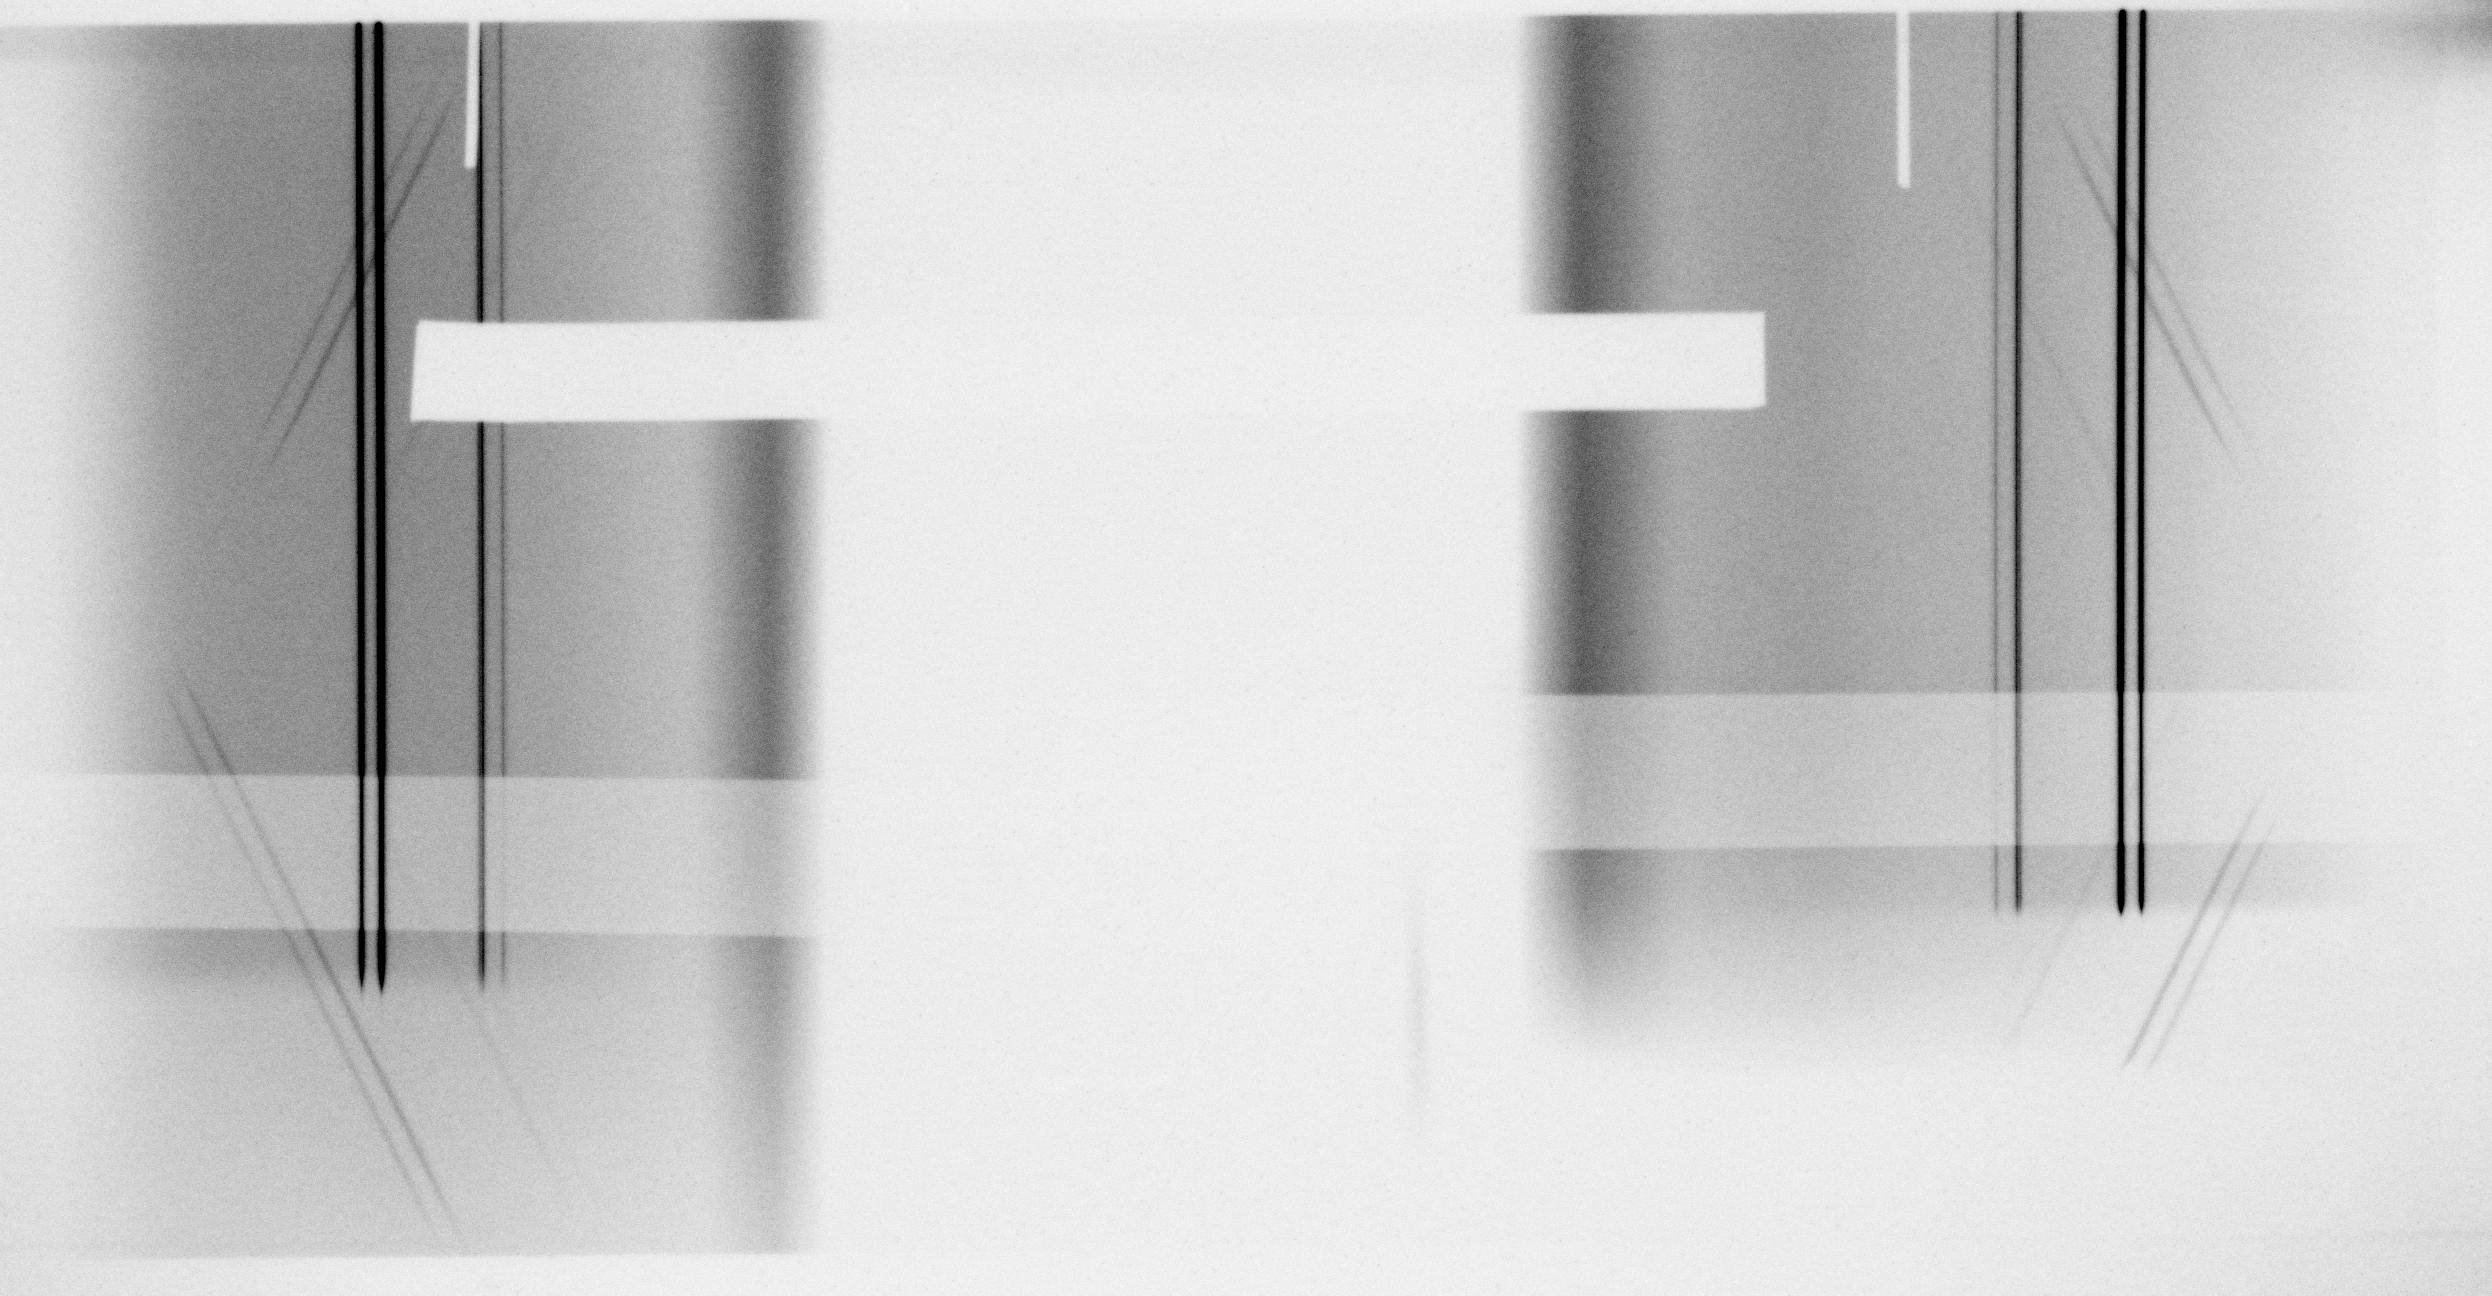
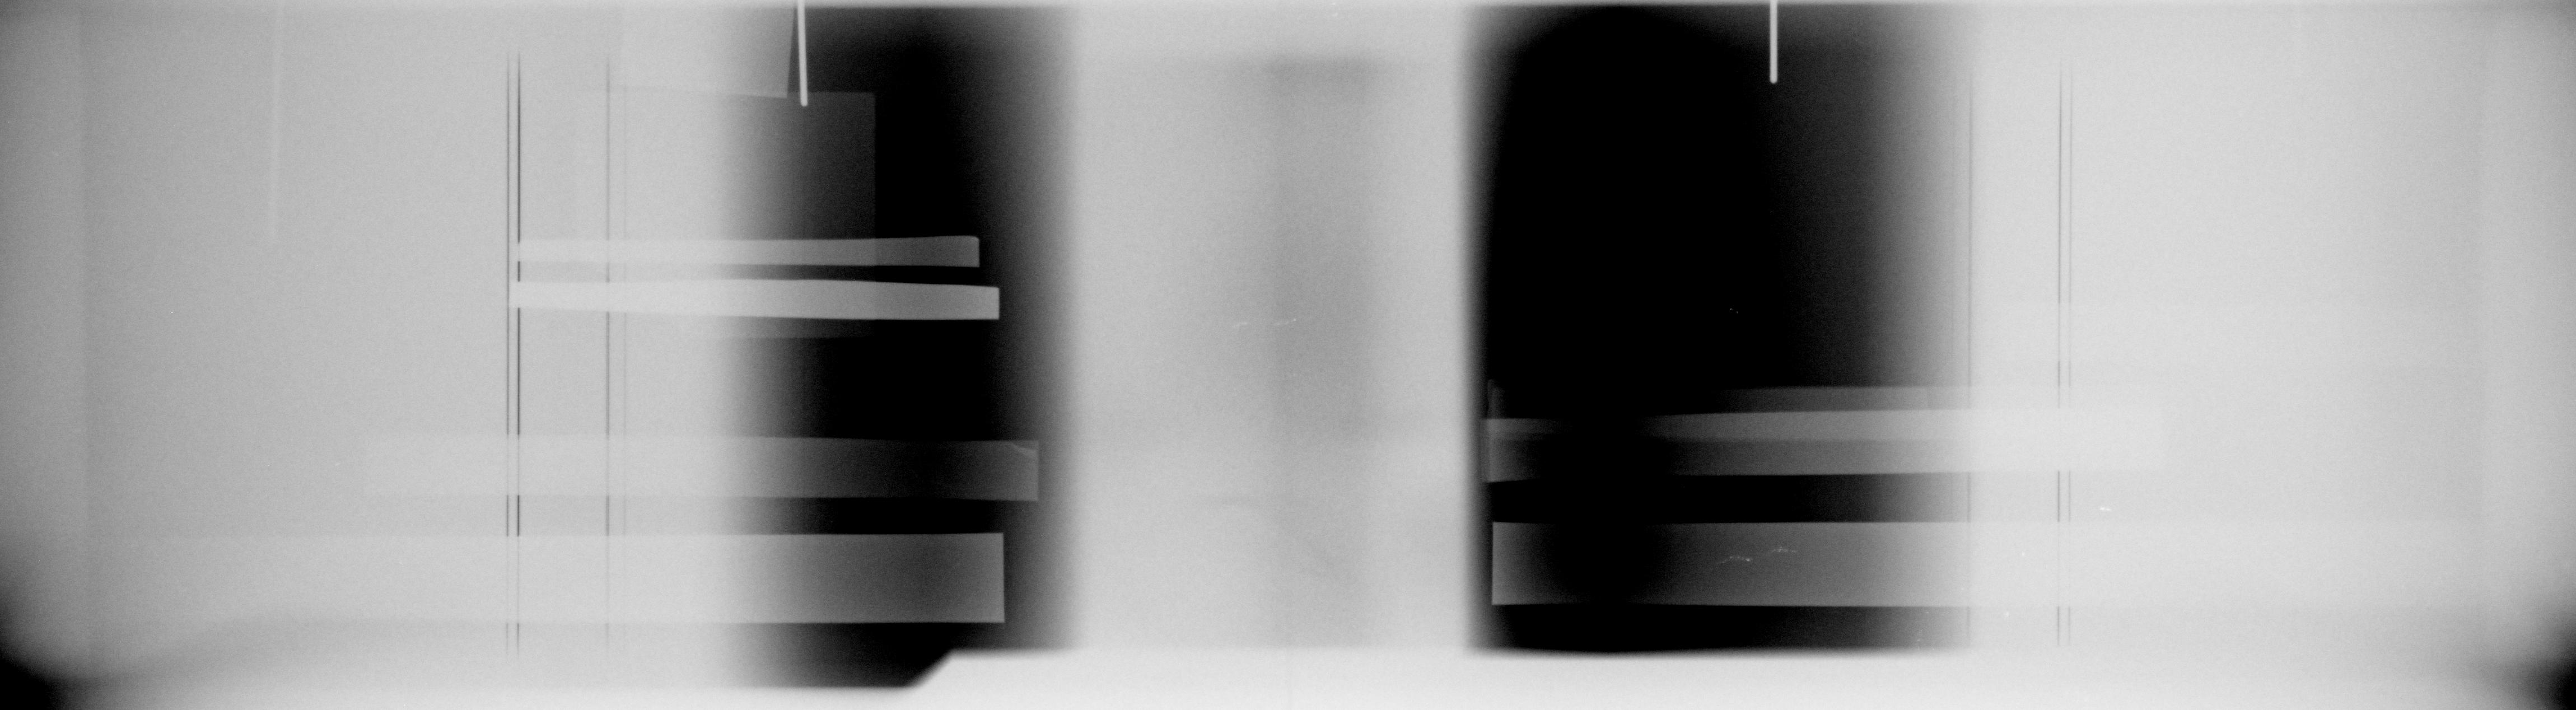
Shot 9525 is a much tighter geometry of the spectrometer's internal shielding, done by aligning the blocks with lasers that trace out the x-ray paths. Also the entrance aperture is narrowed. The change effectively removes the background: on one side the signal to background ratio is now excellent. But, it's overdone: on the other side the lines are cut off. The dark bar is radiation from a strip of U that was intended as an additional filter with higher atomic number. The other strips are 0.254 mm Hf and 0.01 mm Ta. (The jpg is here).
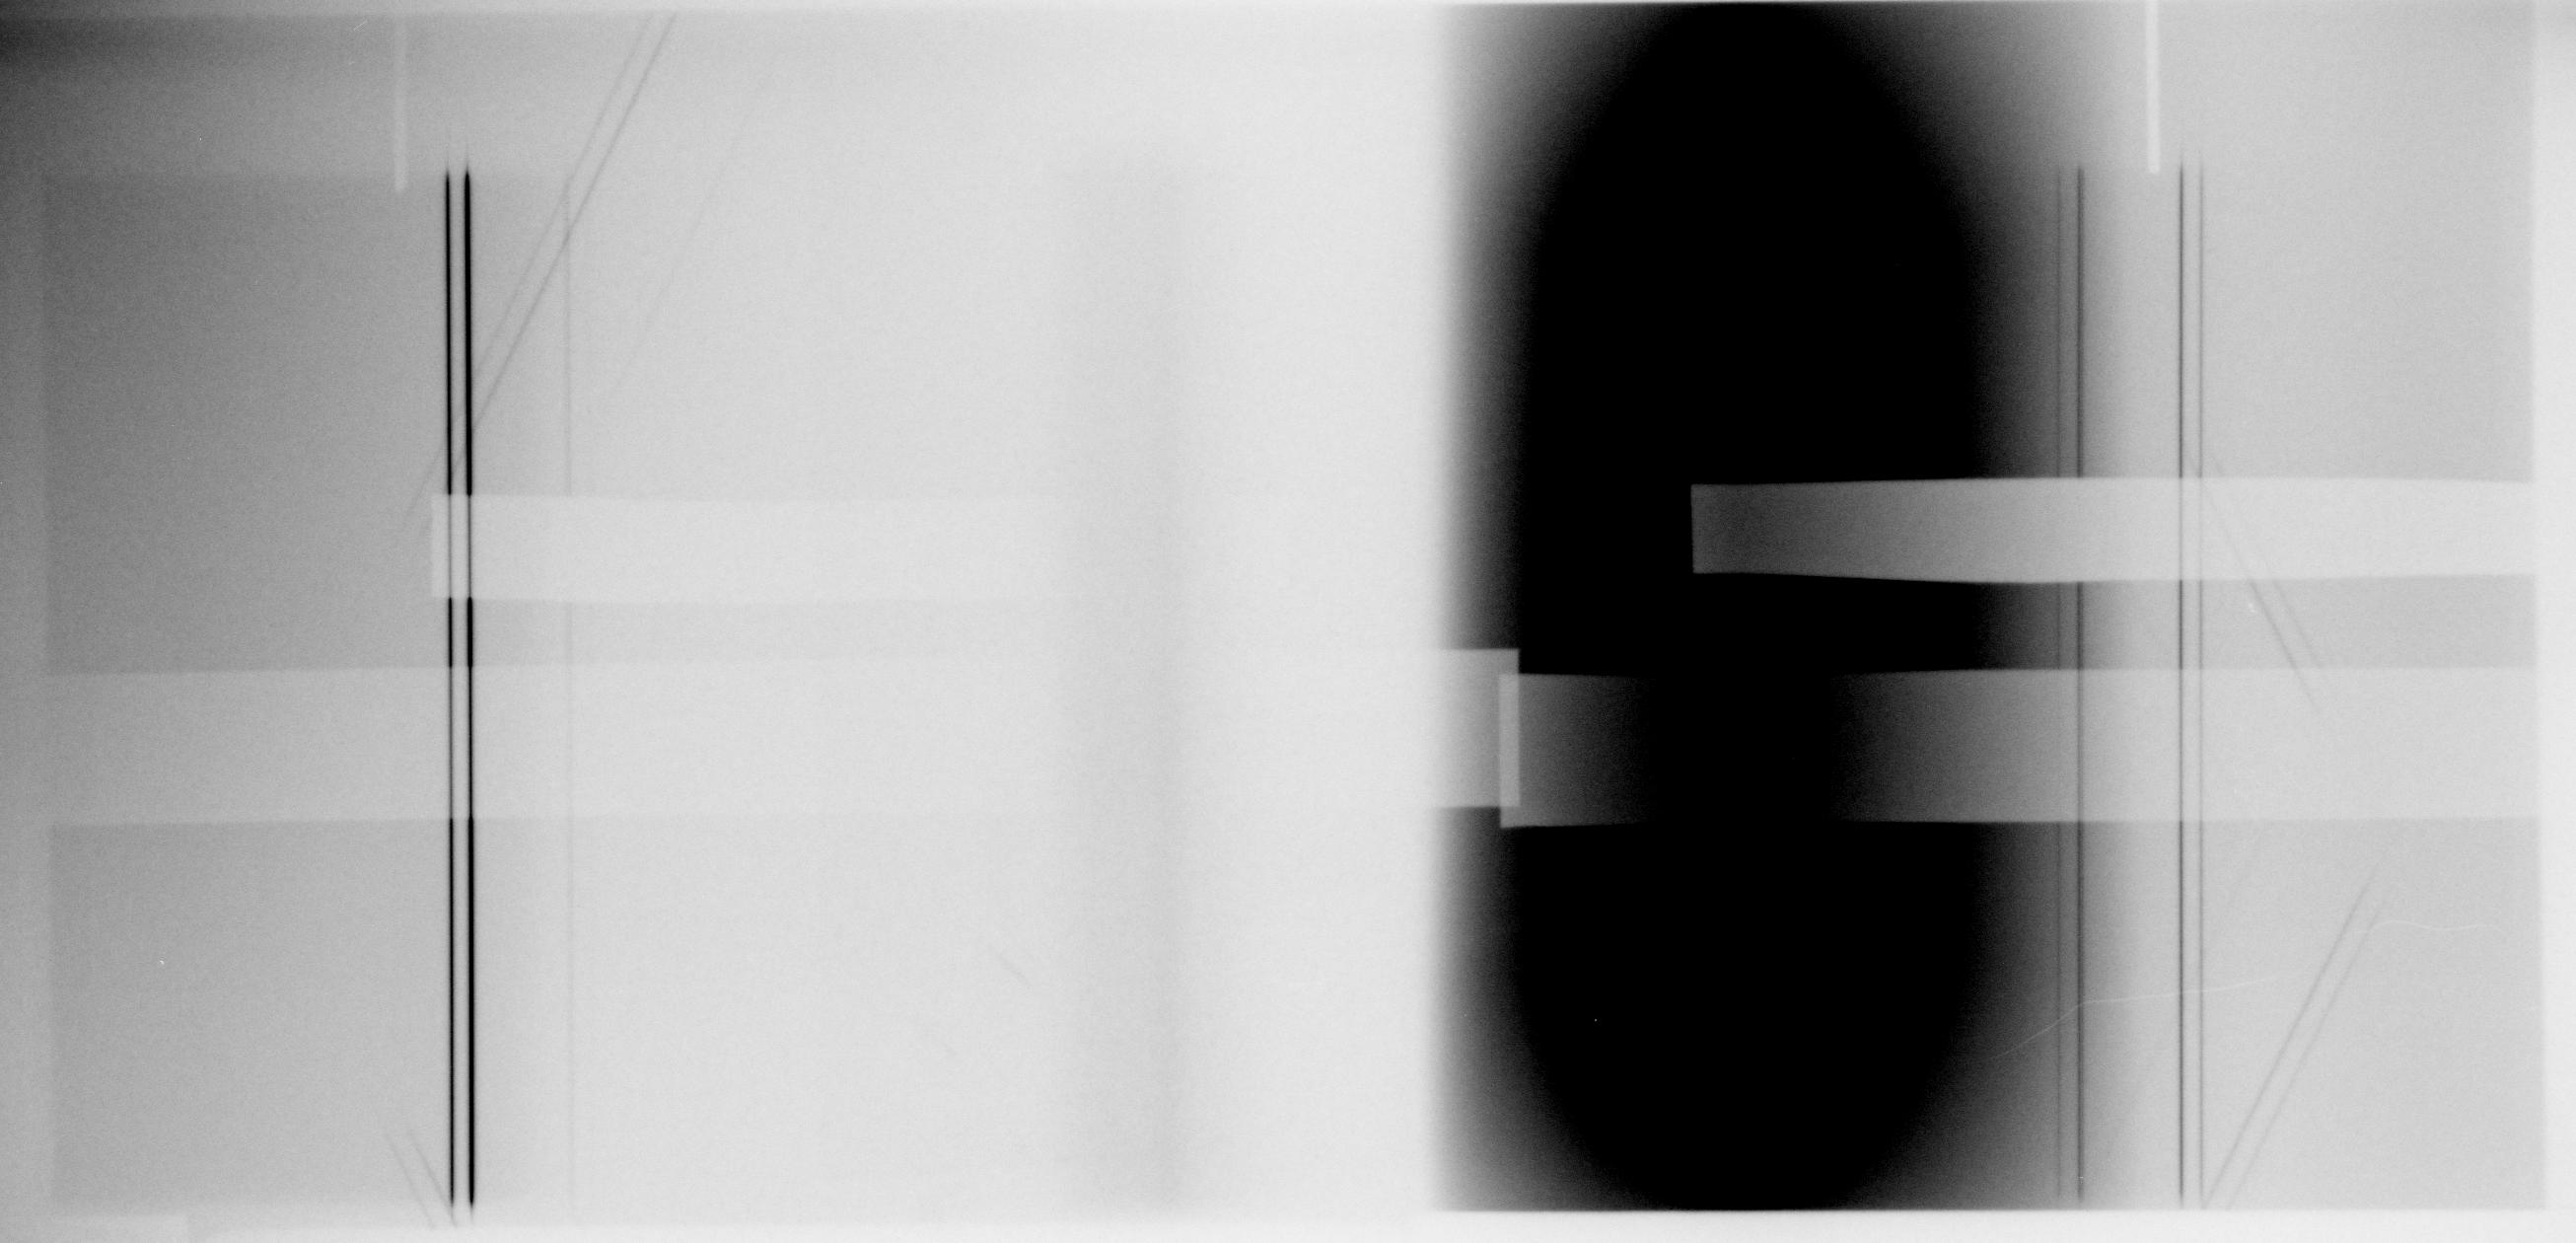
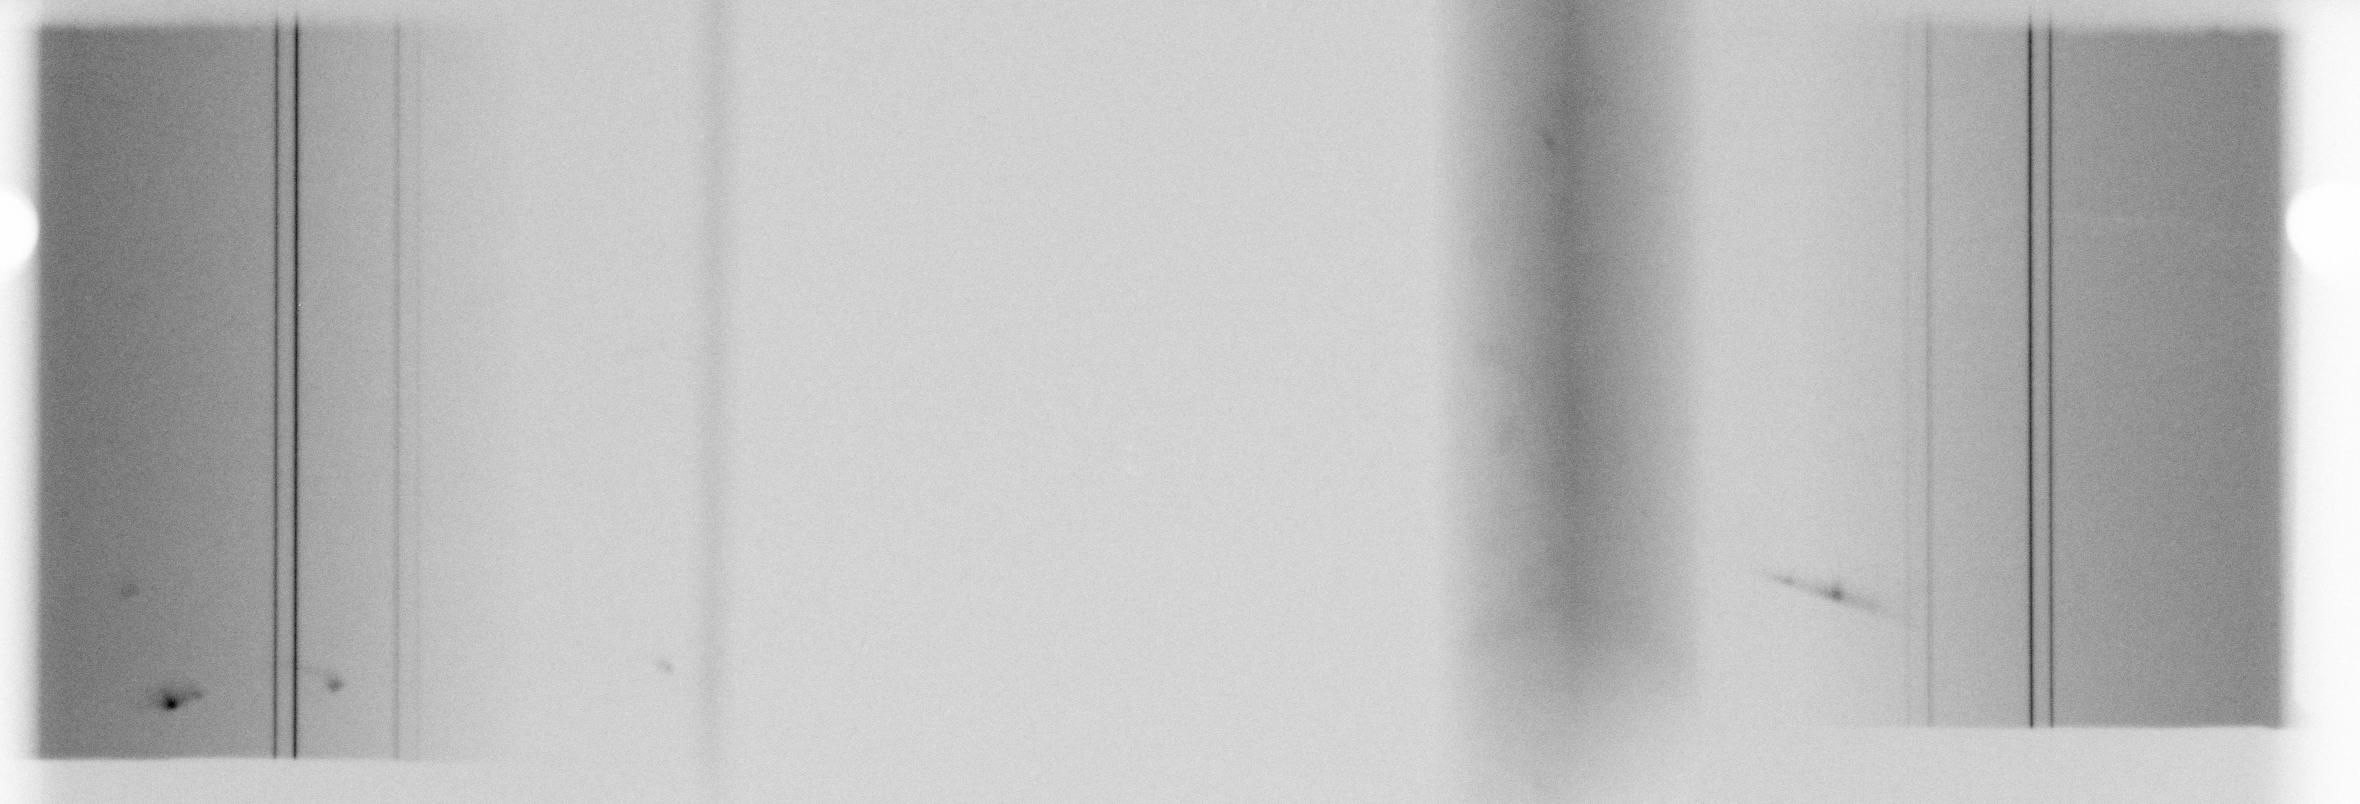
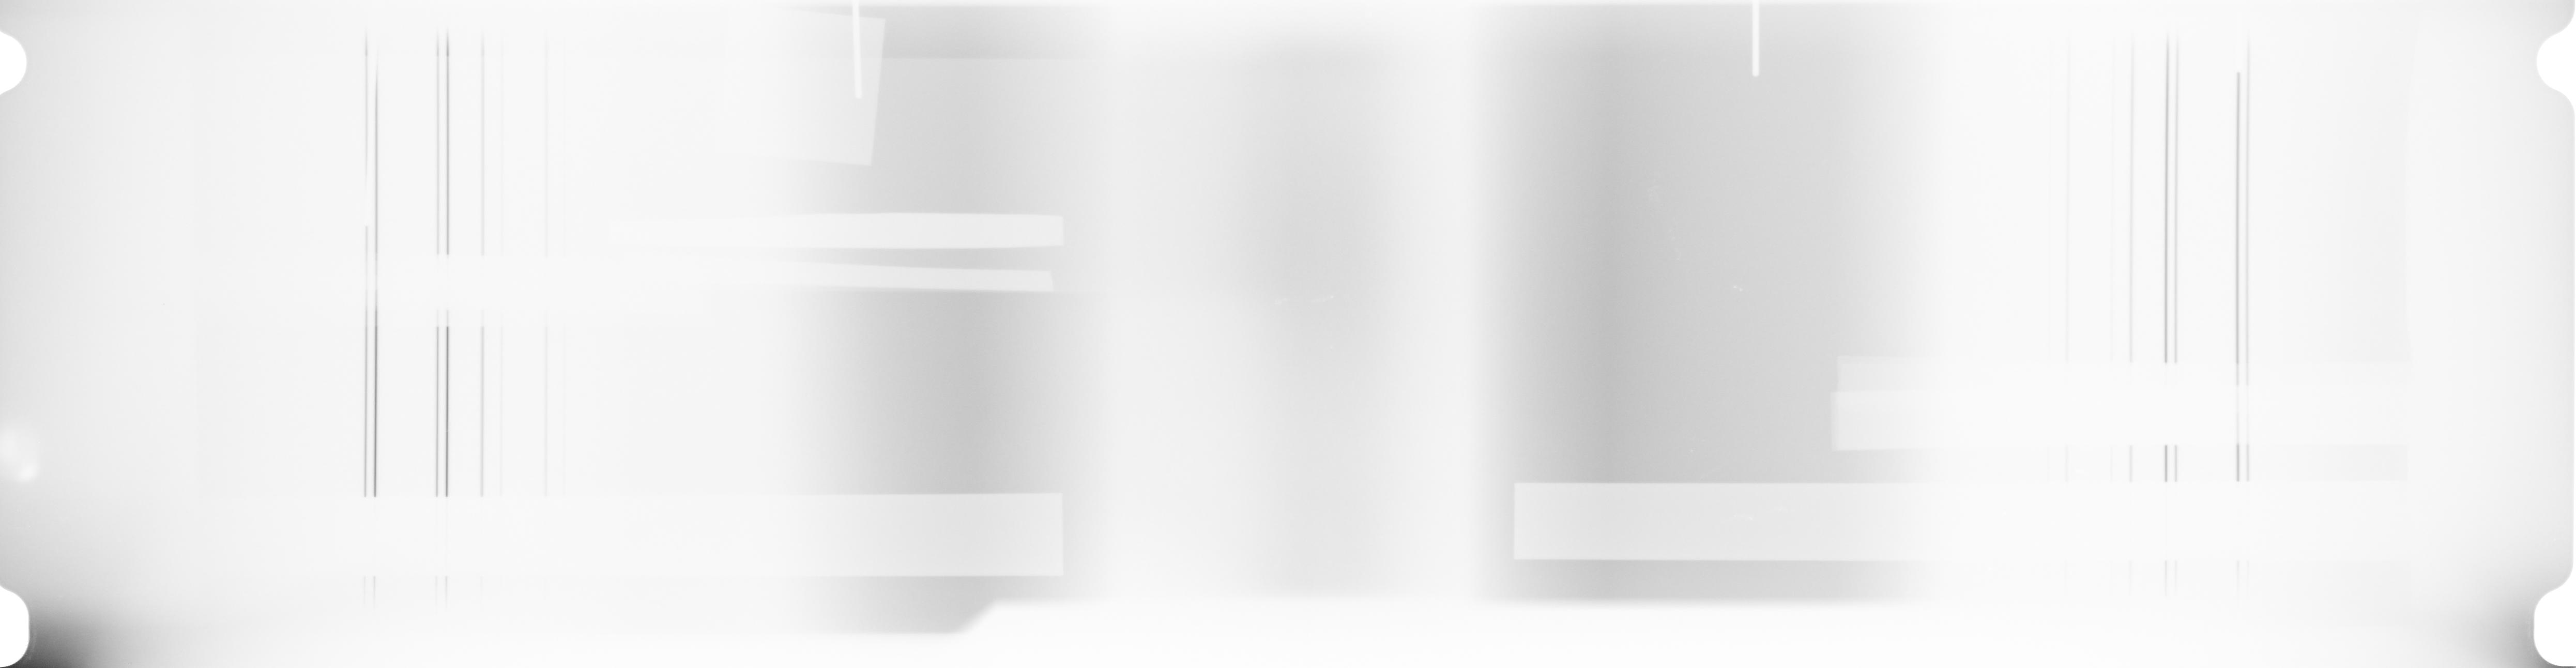
Shot 9527 results from another, still more careful realignment. Laser light reflected from the crystal now goes right back where it came from (rather than being a 1/40 of a radian off in the vertical, it's now perfectly horizontal, and sideways the angle seems less than 1/100 of a radian). The internal shield blocks were re-set so that the spacings are as tight as we dare to make them. It works more or less on one side (the W Kbeta line disappears, so the shield block or the window seems to cut it off), while on the other side brems comes through. The reason may be mis-alignment of the spectrometer with the source. (The jpg is here).
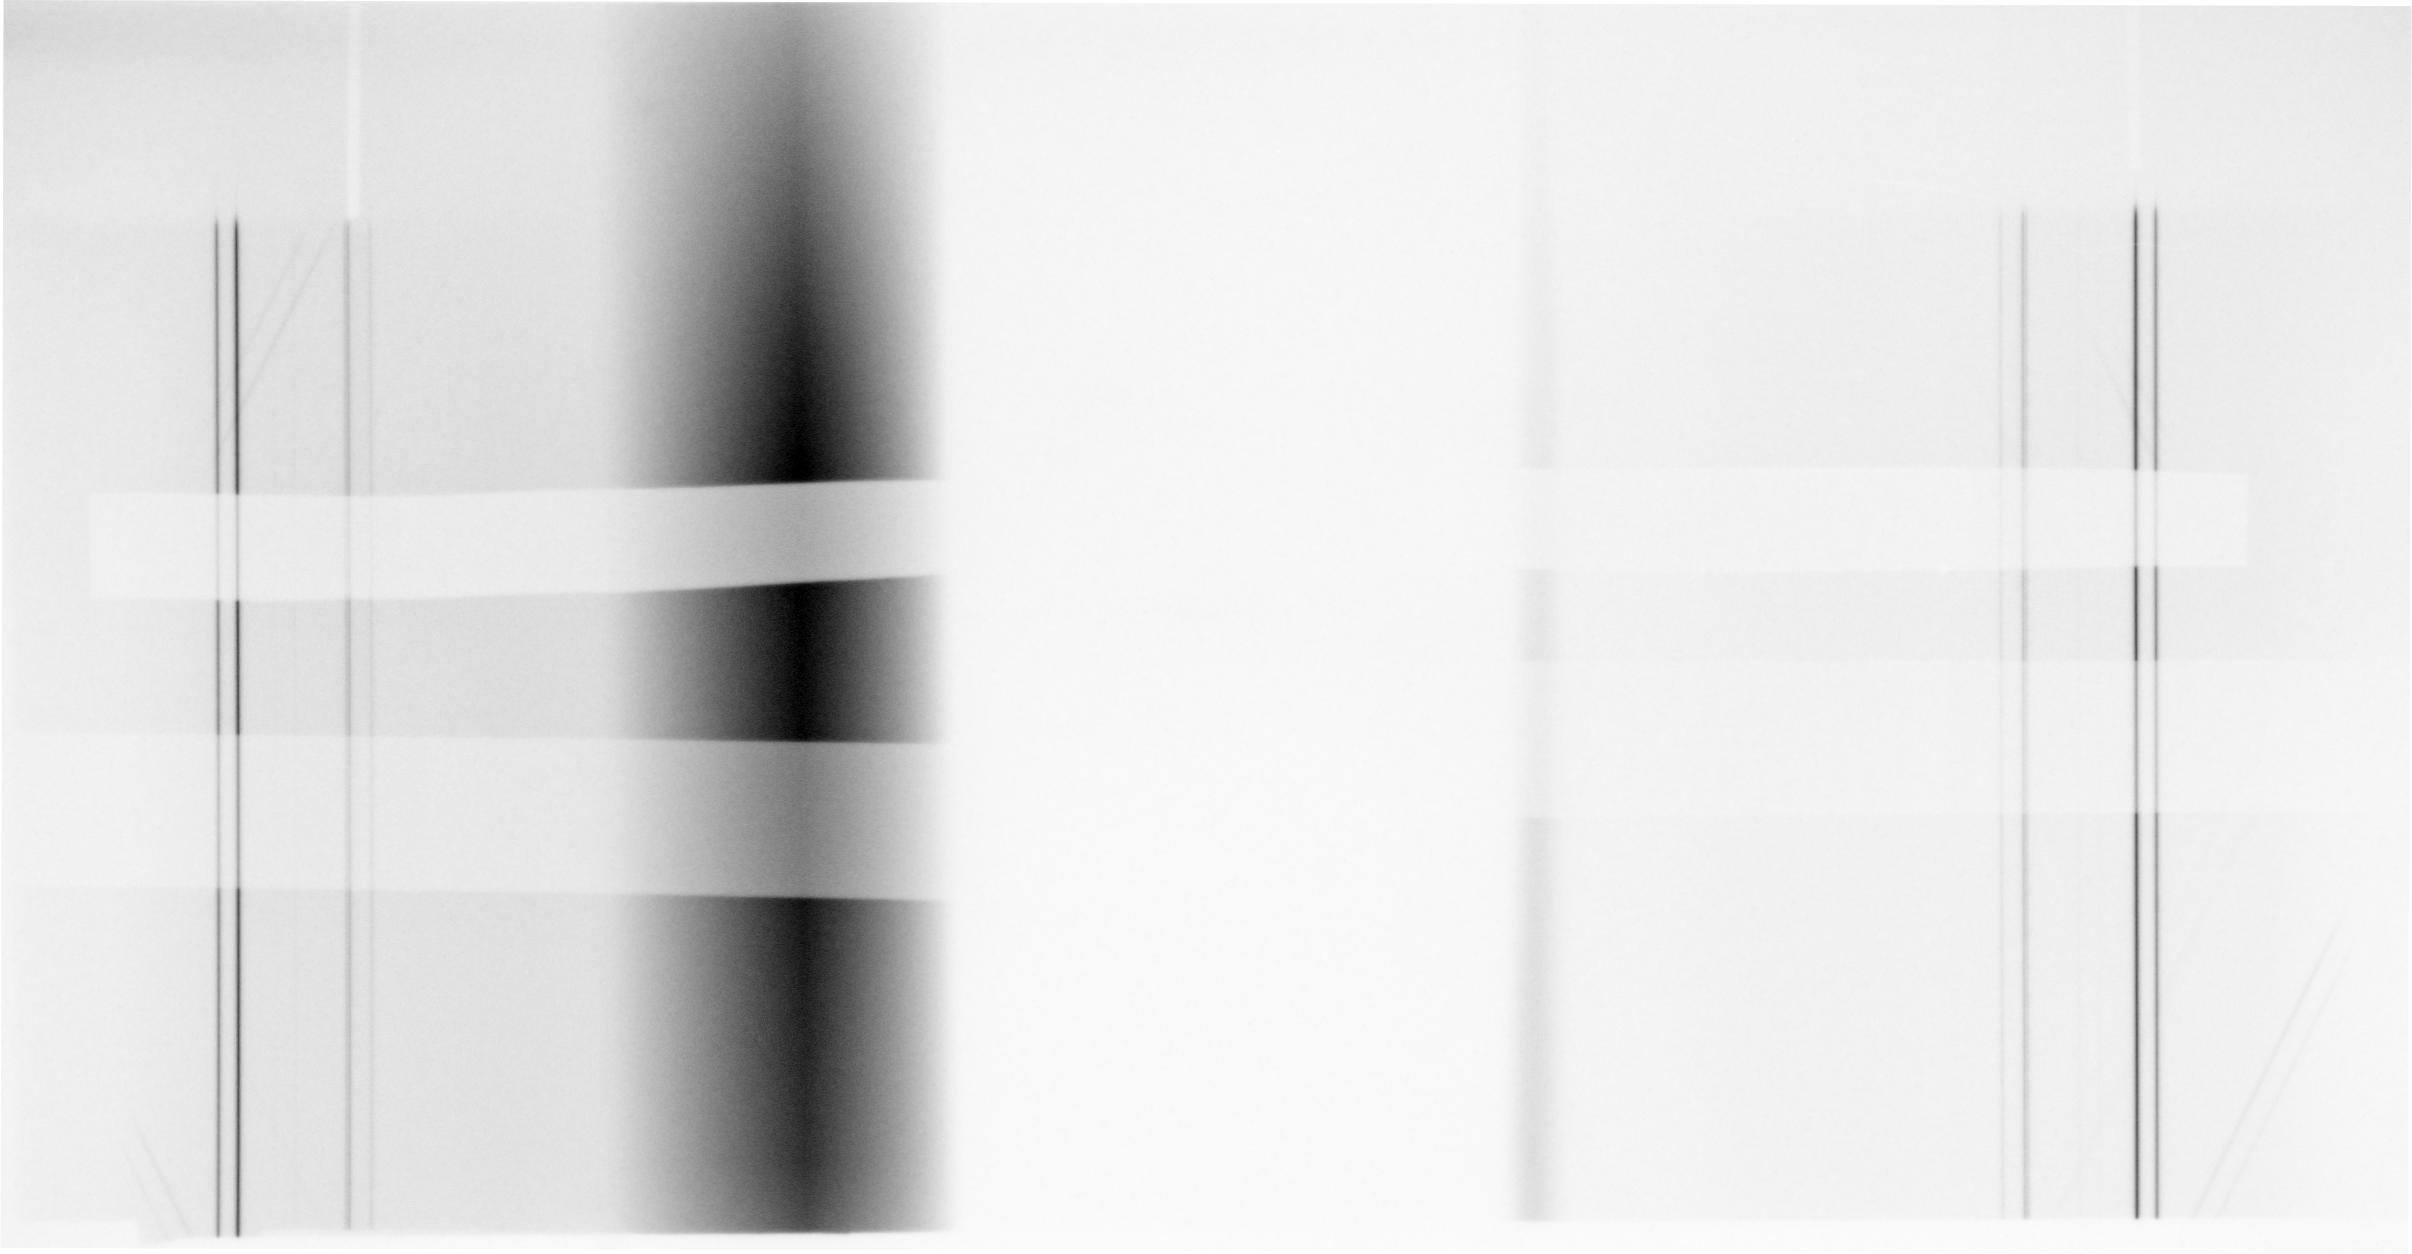
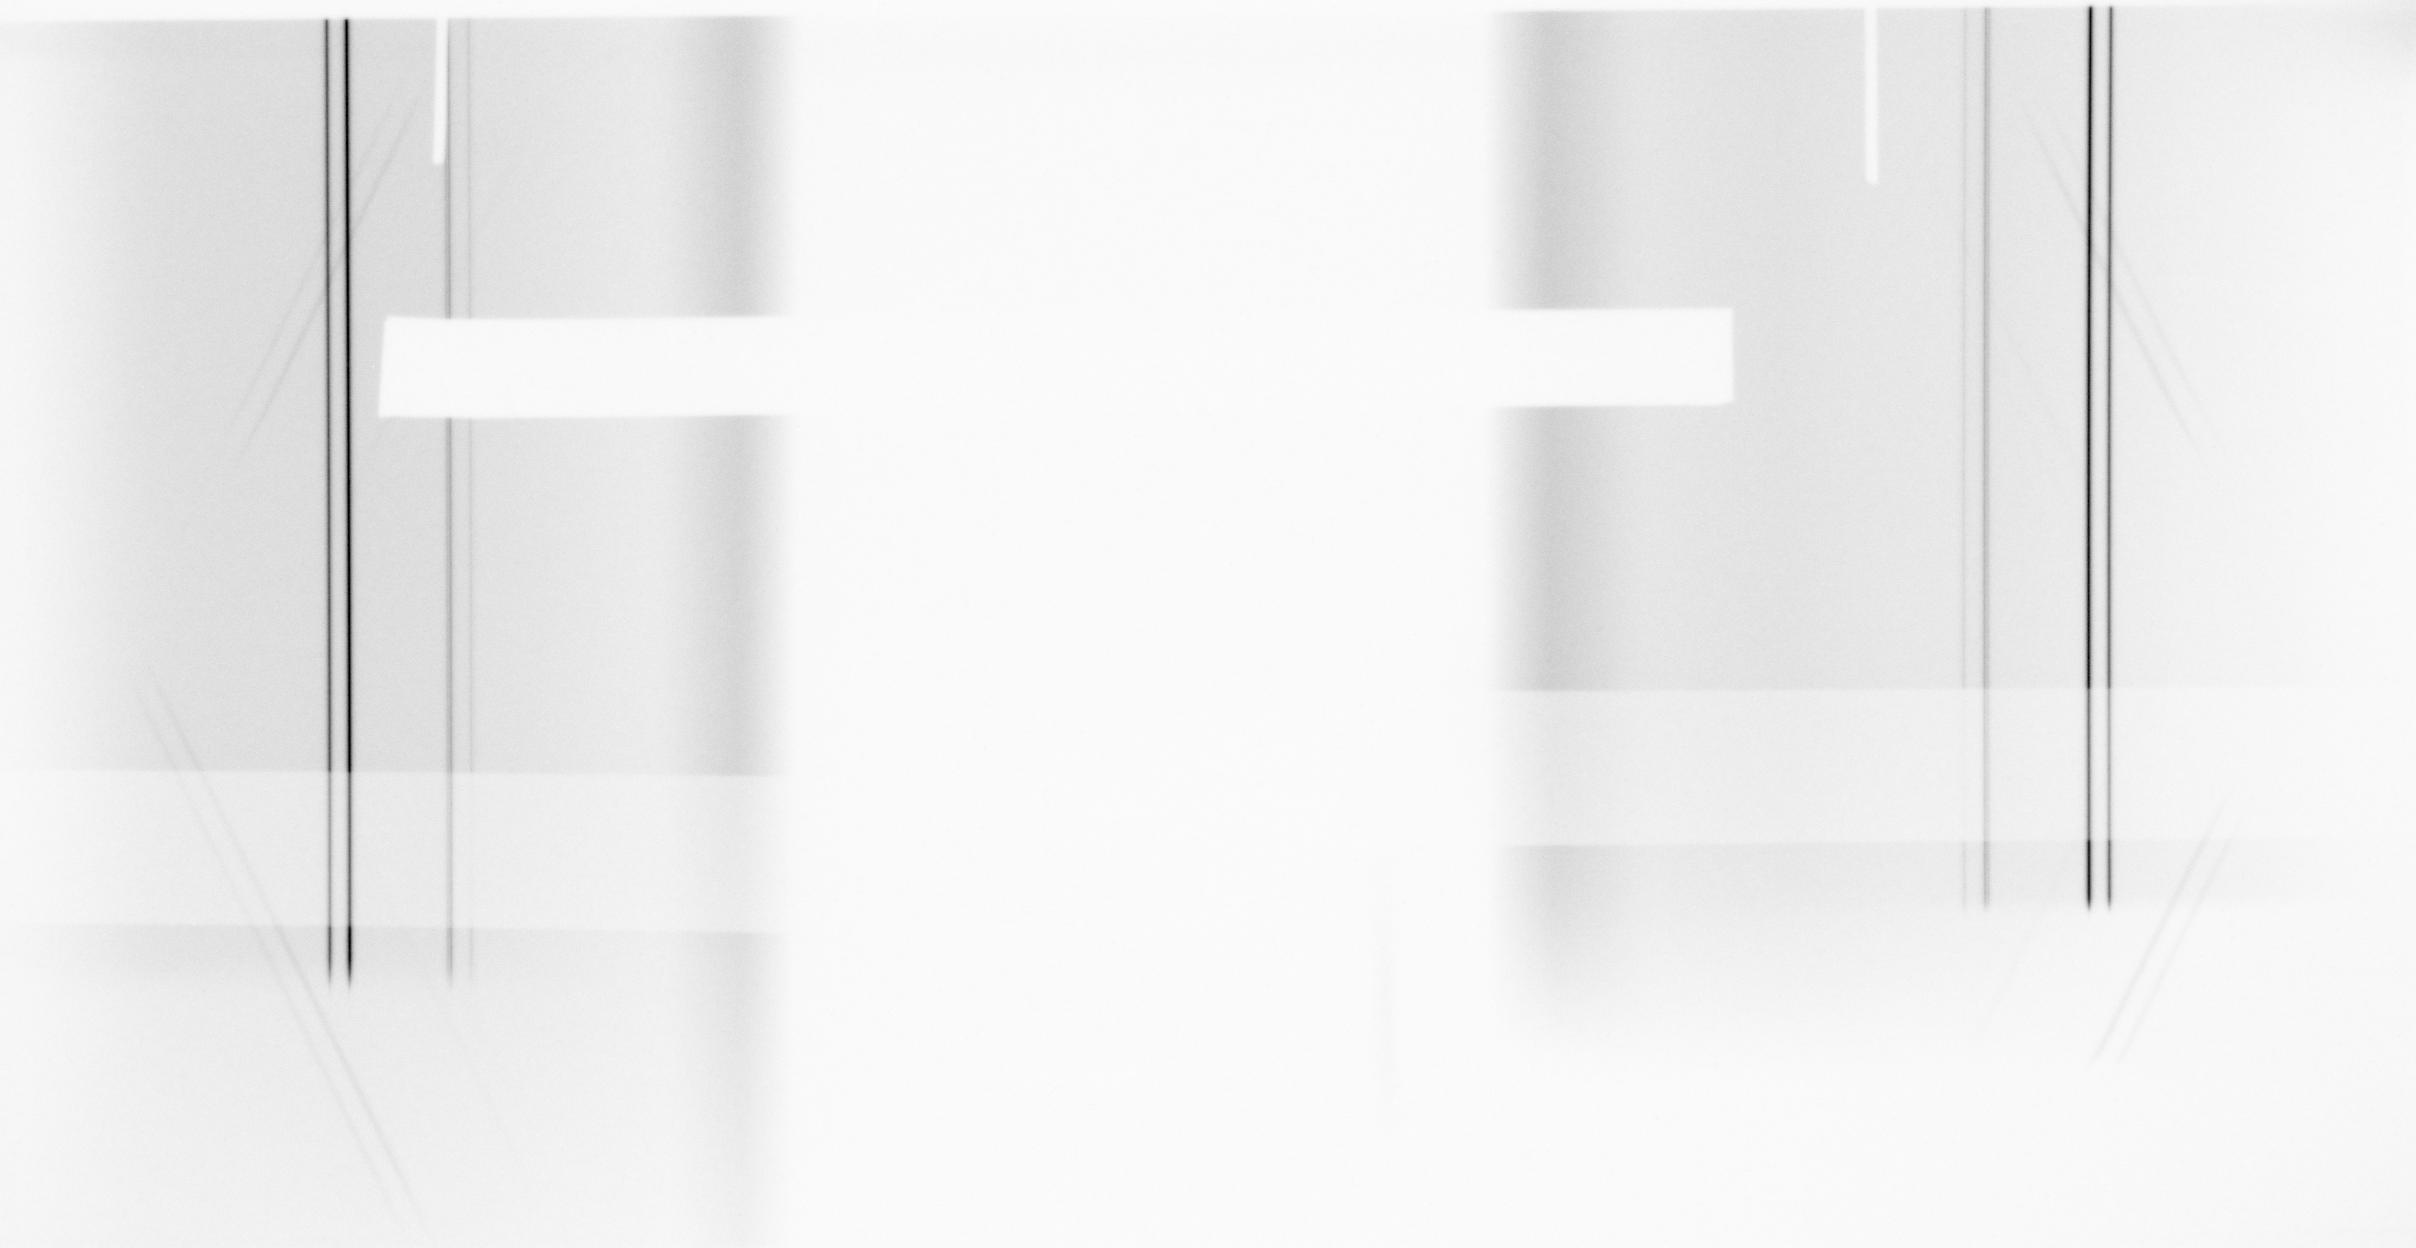
Shot 9528 is still better, again through careful realignment. The material here is lutetium, with Kalpha_1 at about 54 keV. The dark band to the left is bremsstrahlung: its absorption in the (upper) 4 mil tantalum strip is consistent with the photon energy that's amply present in a bremsstrahlung spectrum and most strongly absorbed in the image plate. (The jpg is here).
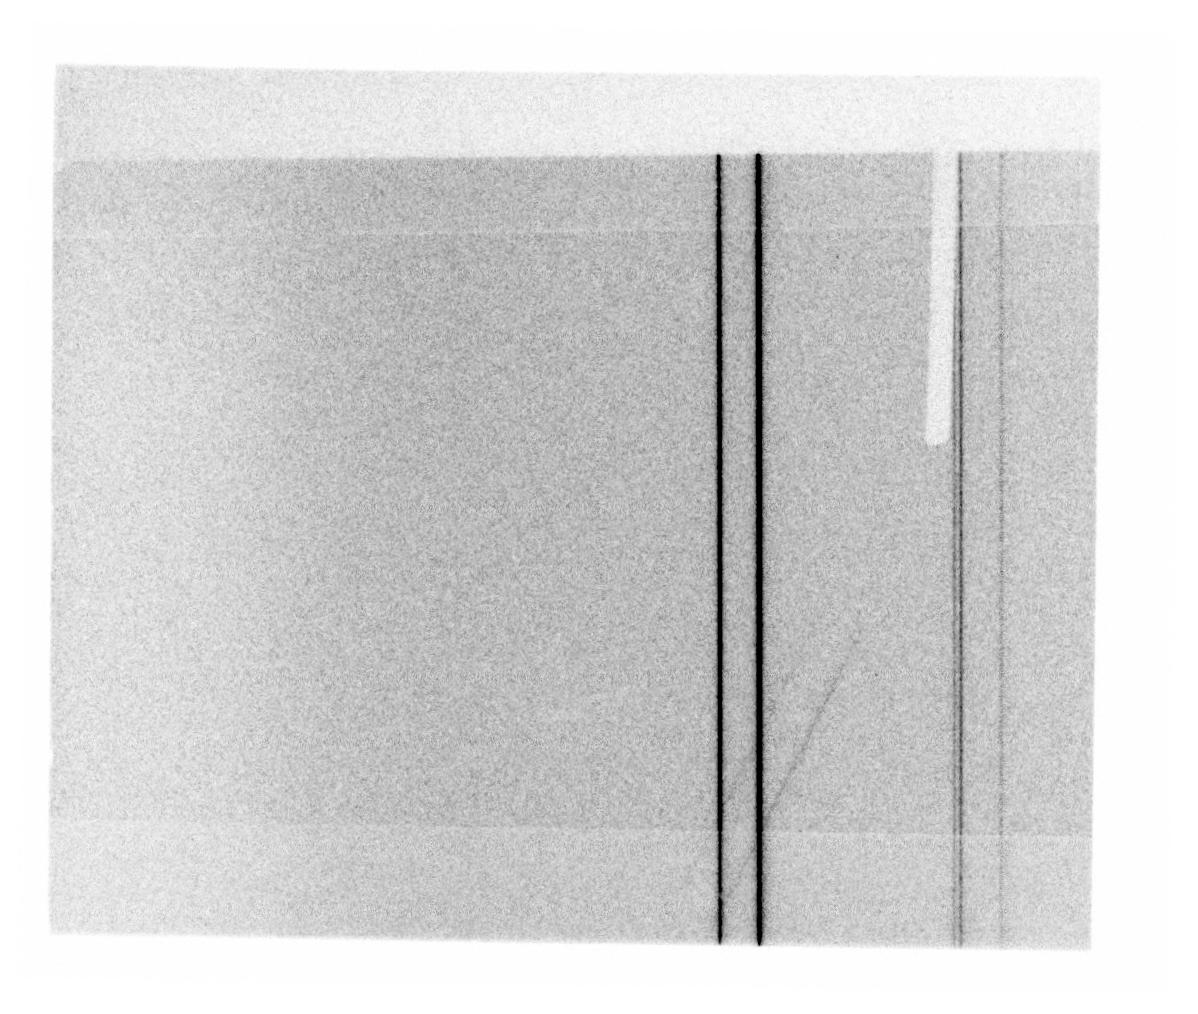
The next shot, shot 9529 on tungsten transmits the same brems (on the left) as the previous shot, despite an attempt to suppress it by even more careful alignment. Apparently, something is not quite right in the spectrometer's inner shielding. The background could be quantified a little on this shot, by three TLDs whose aluminum housings show up as narrow rectangles in the upper left of the image. From the outside to the inside the dose is 47 mGy, 44 mGy, and 44 mGy, while the pixel values behind the housings range from 1600 to 2000: they are not proportional to dose. (in the Kalpha_1 line the pixel value is 2600 or so). (The jpg is here).
After the reasonable results on these two shots, the spectrometer was checked off-line. A 10-minute exposure on a microfocus source, at 80 kV and 0.45 mA in reflection from a tungsten bremsstrahlung target at 45 degrees, shows that the same problem with shine-through happens in the canonical spectrometer version. Viewed in this light the exposures on Gamble II are quite good, perhaps even better than in the well-designed and tightly controlled environment of the microfocus calibration source. The nice thing is that the calibration source can be used to figure out where to put the shielding, so that the shielding no longer needs to be made during the experiment. (The jpg is here).
Pushing the lead blocks that define the cross-over slit closer together gets rid of almost all the un-diffracted x-rays, as is seen here , for the same source parameters as above. Replacing the original lead blocks with tungsten gives a comparable image that is still marred by some transmission. The reason is probably that the tungsten blocks don't have exactly the right shape, so they can't be pushed together sufficiently closely to mimic the slit made by the lead.
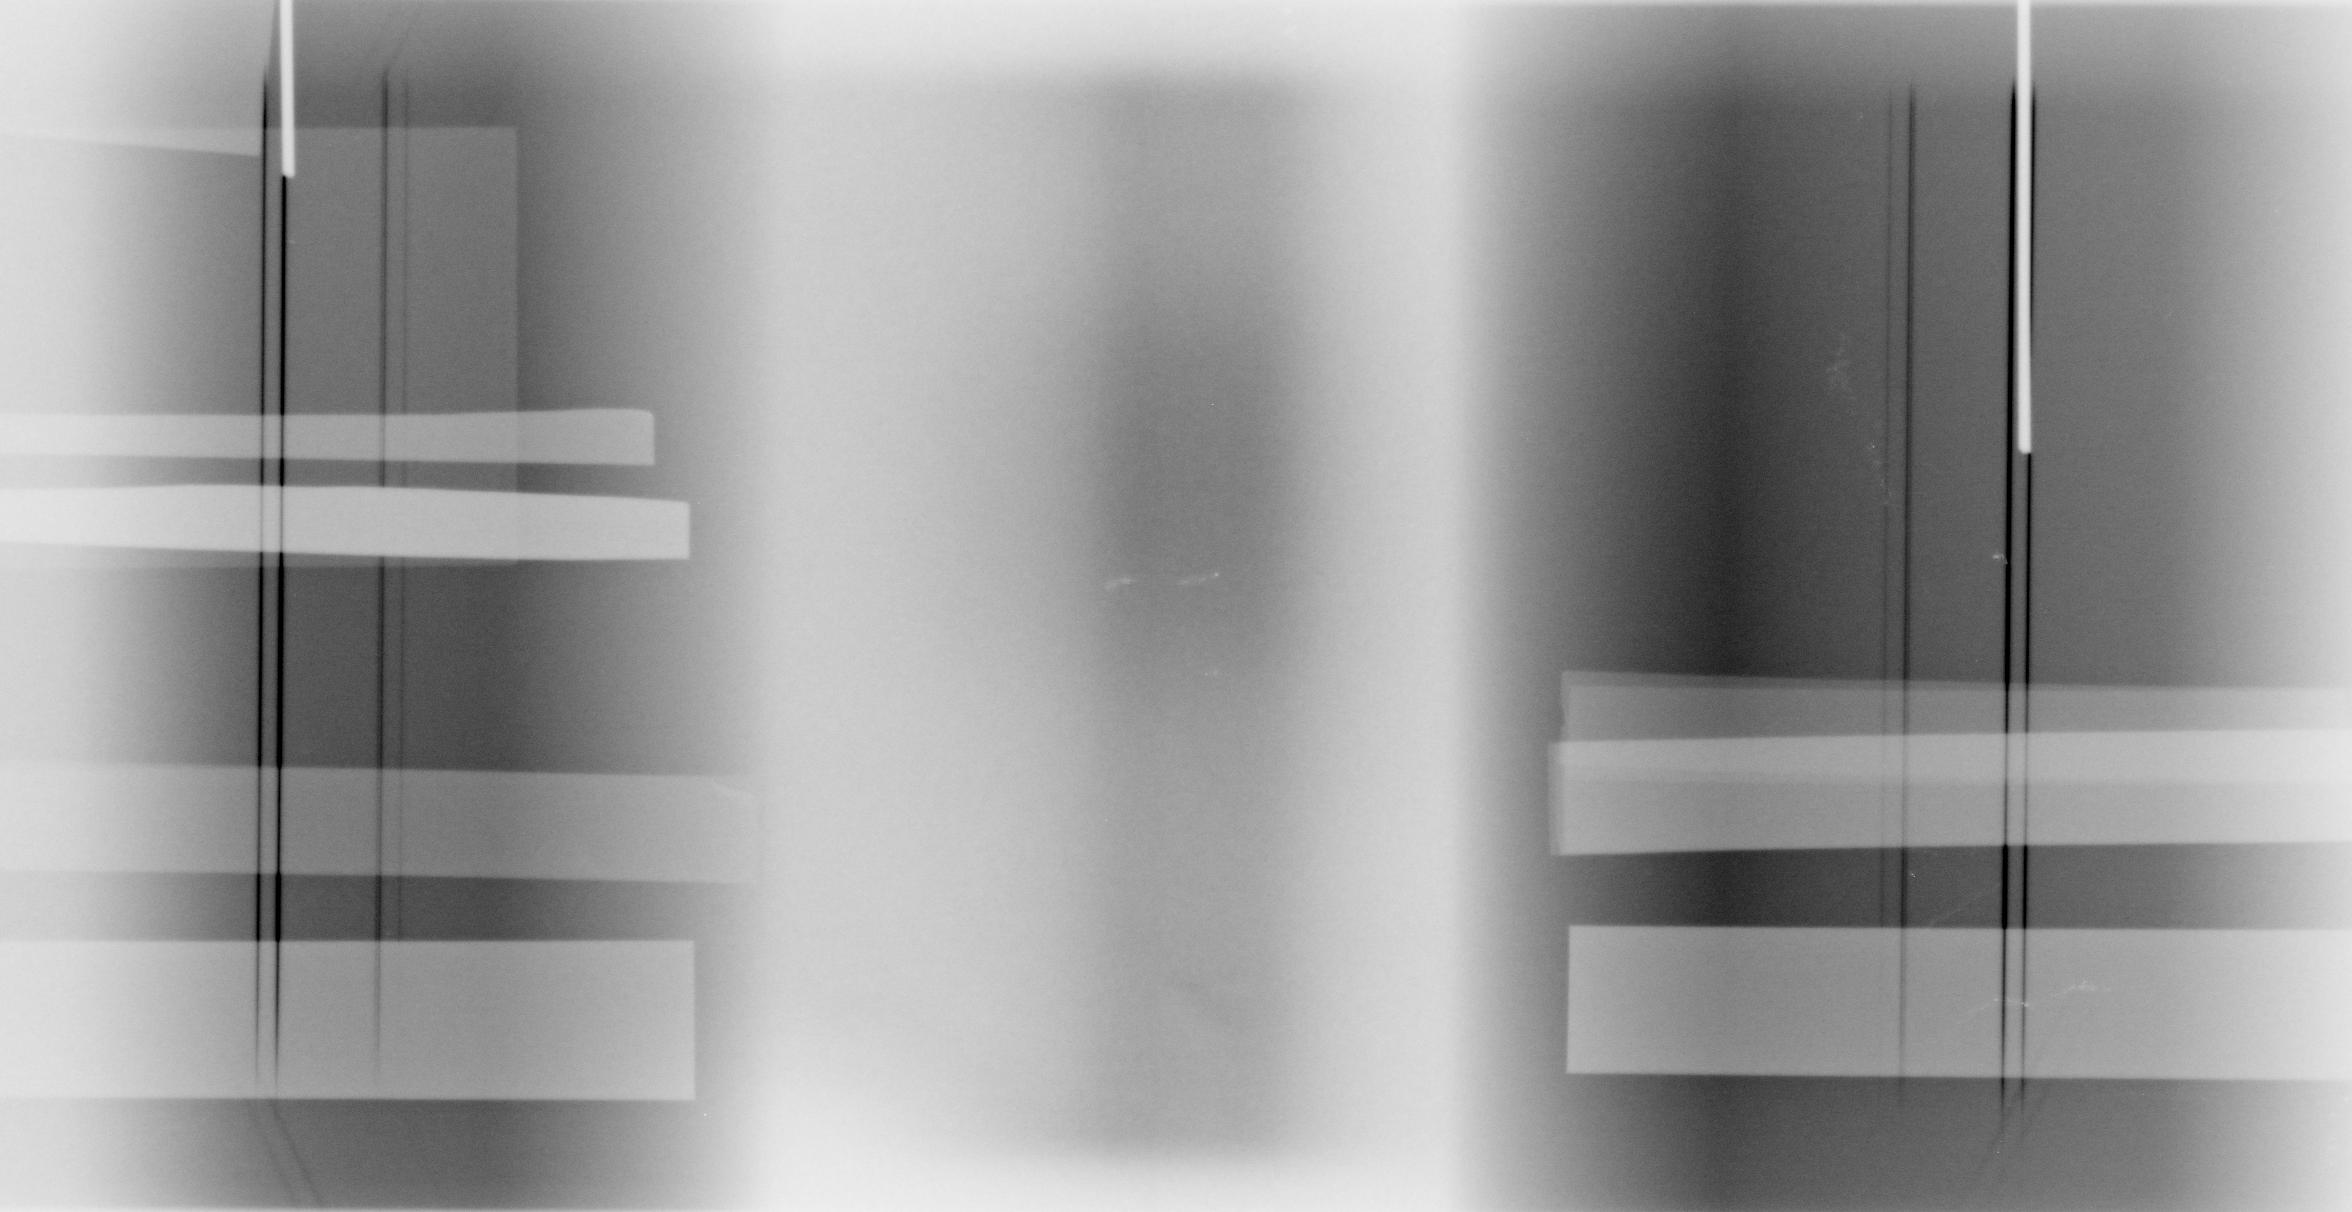
Fixing the blocks in these positions gave the best spectrum yet on Gamble II (perhaps helped by the fact that the shot was not so good, which may have resulted in bremsstrahlung with a lower effective end point that is easier to shield), on shot 9531. The large .tif version is here, the much smaller .jpg version here, Note the attenuation of the Kbeta line by the 0.1 mm thick tantalum strip, whose K-edge at 67.416 keV is just above tungsten's lower energy Kbeta lines (overlapping, at 66.9514 keV and 67.2443 keV), but just below the second, weak Kbeta line at 69.067 keV. On the bottom right side is the penumbra of a rolled edge halfway to the source. This indicates a source size around 1.5 mm.
Repeating the shot with the tungsten rod sharpened to a point gives equally good data. The tif version is here, the much smaller .jpg version here. Higher resolution from another image plate gives an even better spectrum.
It so happened that these two good spectra were obtained with a sick Marx. Once this was fixed, we tried to repeat them on the next two shots. To our disappointment the spectra were not nearly as good and are not shown. The last shot was not on a tungsten rod but on a tungsten hair stuck into a piece of Cerrodur (a low melting point alloy with much lead and bismuth). Here the radiation, and also the spectrum was really weak.
After this intense period of shooting the machine had to be used for other (but related) measurements. This gave sufficient time to improve the setup, in various ways as suggested by the results obtained to date. Most importantly, the spectrometer's alignment with the source was improved, by making the spectrometer's re-positioning after each shot more reproducible, and by improving the spectrometer's shielding. The aperture plate is now made from 32 mm tungsten instead of 10 mm lead, the aperture is now just high enough (10 mm) to match the aperture in front of the image plate 965 mm away, and it is just wide enough to accommodate the maximum photon energy of interest, with side walls that are slanted toward the source.
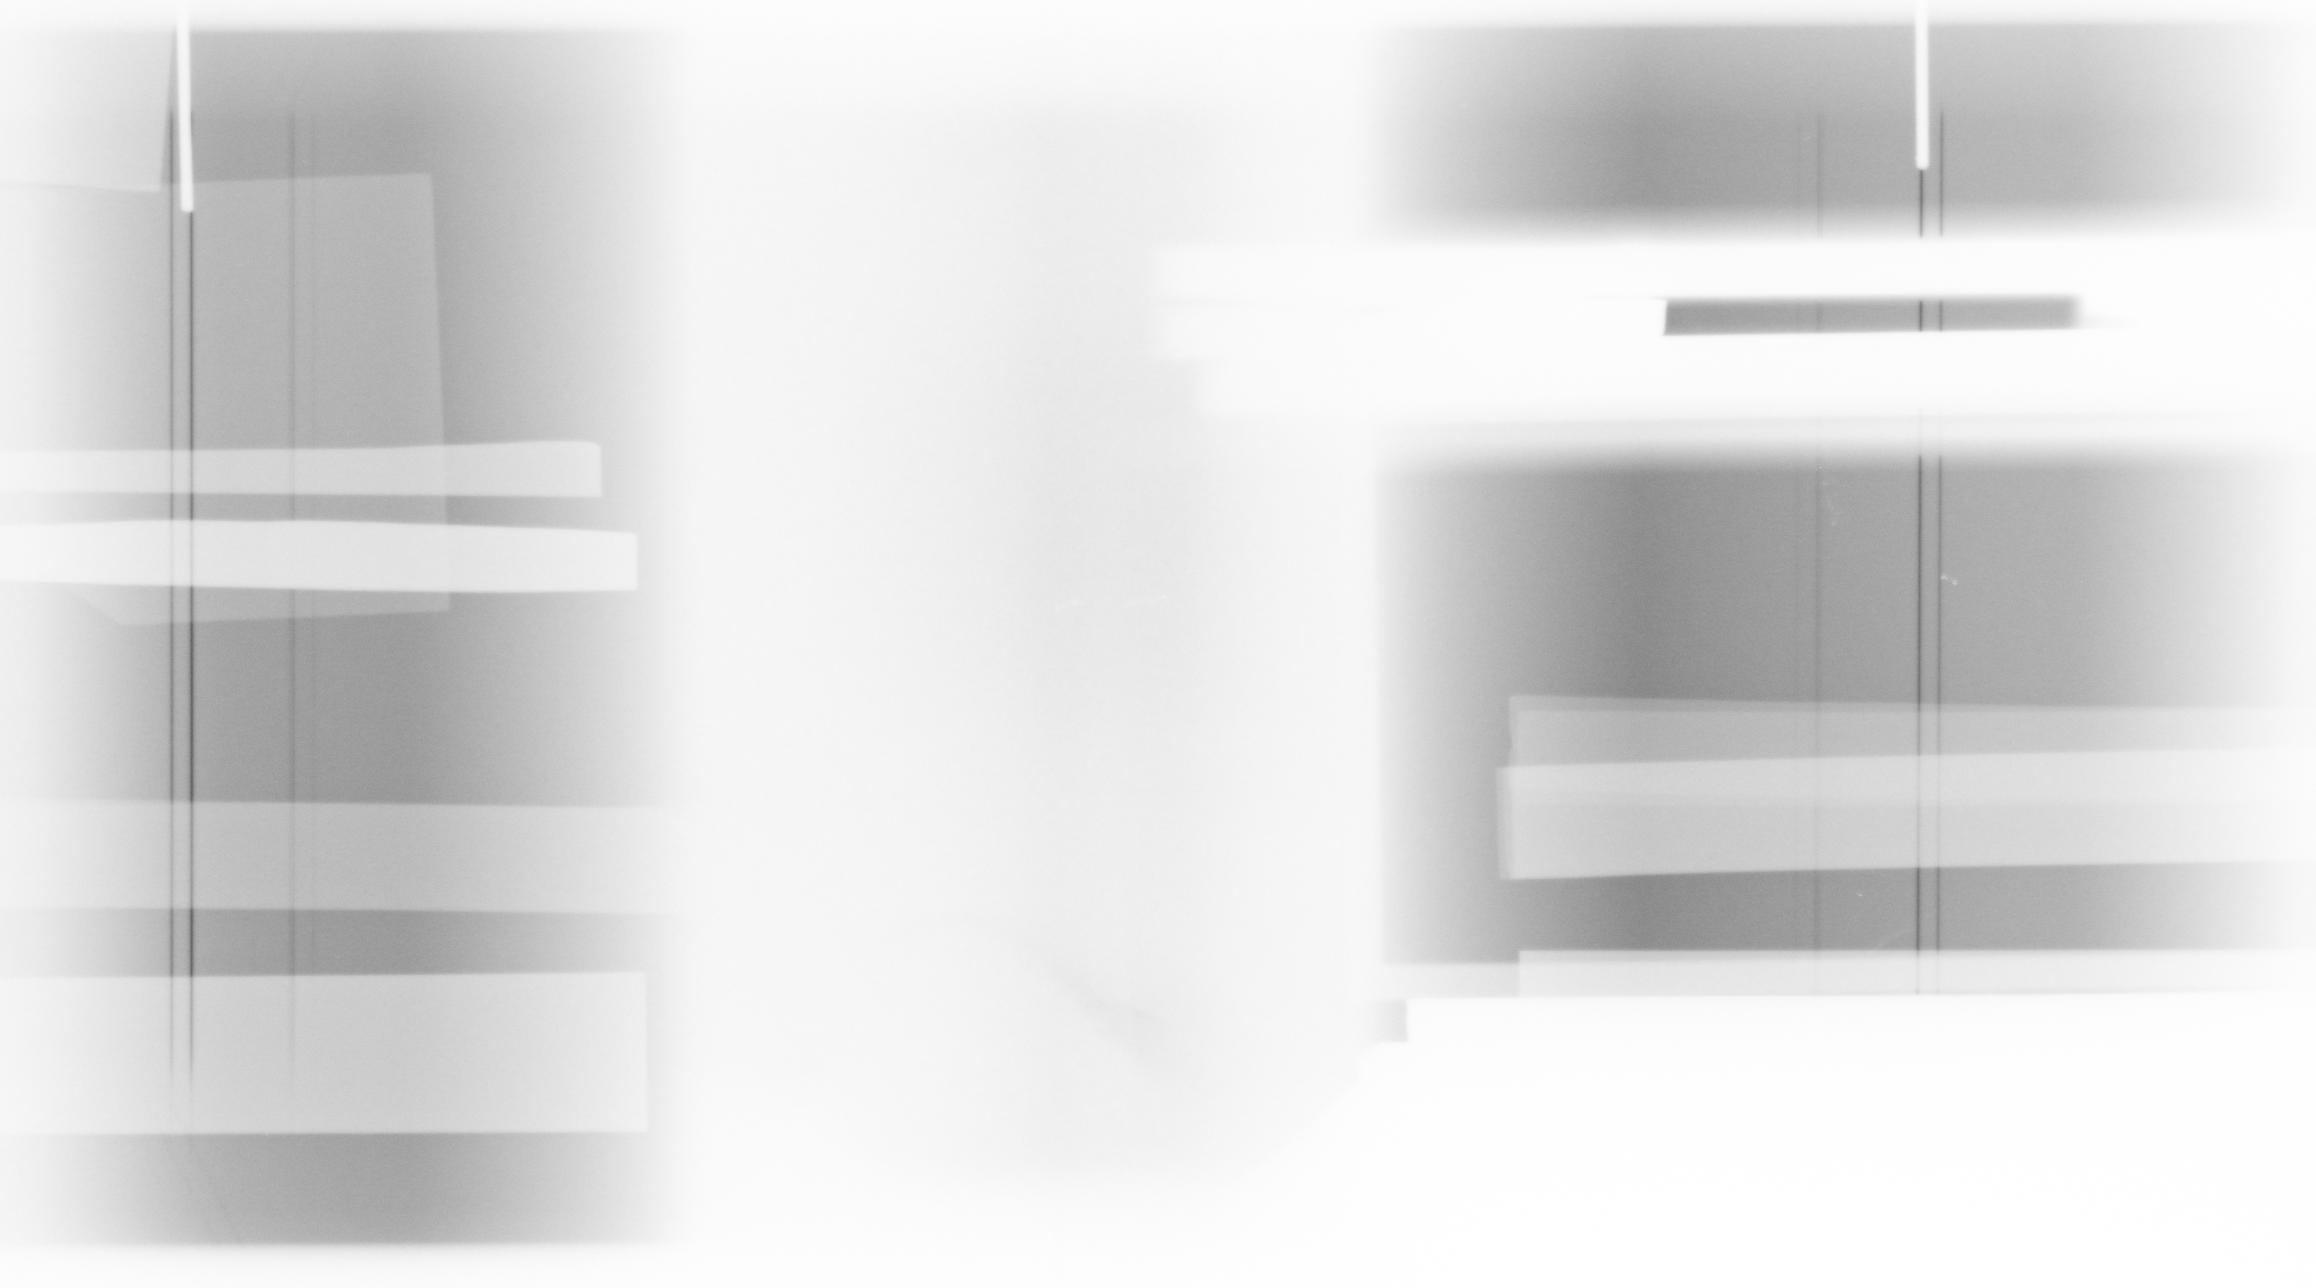
The first shot in the next series, 9546, on Friday 23 October, gave intense K-shell lines but only on one side: clearly, the shielding and the alignment is not yet good enough. However, this single spectrum is excellent, with the same suppression of the Kbeta already seen in the previous series. This time we also saw the tungsten lines in second order, not 5x lower as expected but approximately 40x lower than the first order. A very large image is here, a much smaller image here.
After re-alignment and some iteration, the shots starting with 9548 all gave excellent spectra provided that the machine cooperated (it didn't on one shot, 9550). Most .tif files have been distributed, and put on Stella, so that this web site gives only the much smaller .jpg images.
Shot 9548 has a 1 mm diameter blunt tungsten rod, seen here. It is the standard shot to which all other shots should be compared since the spectrometer was not adjusted further.
Shot 9549 is a repeat, to verify reproducibility. This is very good, as seen here.
Shot 9550 failed and is not shown although it was useful: it had a rolled edge half-way the source and the image plate: its penumbra showed that the background would come from a ~10 mm high region if this were at the spectrometer's front.
Shot 9551 is a repeat of shot 9550, to verify that the machine is in good shape again. Its image is here. On the right side (looked at from the source) the rectangular aperture placed half-way between the crystal and the image plate lets the Kalpha lines through, but stops the Kbeta lines that are clear on the left size. The background of the K-lines behind this aperture, and the penubra all around, suggests that the background comes from a relatively small (maybe 10 mm) source in line with the K-lines, and not from x-rays scattered from elsewhere.
Shot 9552 is a repeat of shot 9551, but with a sharp tungsten rod. Its image is here. On the right side (looked at from the source) the rectangular aperture placed half-way between the crystal and the image plate lets the Kalpha lines through, but stops the Kbeta lines that are clear on the left size. The background of the K-lines behind this aperture, and the penubra all around, suggests that the background comes from a relatively small (maybe 10 mm) source in line with the K-lines, and not from x-rays scattered from elsewhere.
In the upper left is the shadow of a second image plate. Its image is here. This plate's higher resolution can separate all 5 major K-shell lines, including the Kbeta3 at 67.9514 keV and the Kbeta1 at 67.2443 keV.
Shot 9553 has a blunt rod, but with different plasma conditions. Rather than 18 microseconds delay the plasma guns have a 12 microsecond delay. Its image is here. To the right in this image is an improvised Soller slit, two 3/16 inch lead plates 10 inches long, separated by two 3/16 inch high strips of lead. The Soller slit are a more effective way to reduce the background than the aperture in the previous shot, and the fact that the background remains shows that the background's source is behind that of the K-lines, either the crystal itself or material that scatters x-rays behind the crystal. At this time we suspect the front end of Gamble II itself, which is not expressly shielded against irradiation and therefore could be a secondary radiation source.
Shot 9554 had a rod pinch of neodymium (Nd, atomic number 60). The Kalpha-1 line at 37.361 has of course shifted to its rightful position, but the background remains the same. Its image is here.
Shot 9555 is a rod pinch with a tip of cesium iodide (CsI, with atomic numbers 53 for I and 55 for Cs). The two Kalpha lines for I at the far right, with the largest of these (Kalpha-1) at 28.612 keV, are nicely separated from Cs's Kalphas, with Kalpha-1 at 30.973. The two groups of Kbeta lines are also well resolved and easily visible. The background is uniformly low over the whole region, so that we do not have to worry too much about certain wave length being cut off. The overall image is here, but it may be more instructive to download a 2 Mb tif image with higher resolution, here . A line-out of the top part, unhampered by a tungsten pin that just happened to be right in between the two Kalpha lines from iodine, is here.
Only this last shot, with CsI, seems to give unambiguous evidence of an anomalous ratio between the Kbeta and the Kalpha lines, possibly more in the I lines than in the Cs lines. In both lines the theoretical ratios are 54/100/9/18/5.5 (in this order:Kalpha-1/2, then Kbeta-3/1/2), but reading from the maxima the Kbetas are suppressed by a factor-2 at least. However, the analysis should be redone by matching the line shapes, and correcting for a gradual decrease in the sensitivity of the image plate as the photon energy comes closer to the barium edge, at 37.411 keV, that happens to be close to the left side of the image.